
Delivery Events Walkthrough
Overview
Delivery Events is the real-time log of all email sending activity across your account. Every email sent, bounced, failed, or otherwise processed appears here.
Step 1: Access Delivery Events
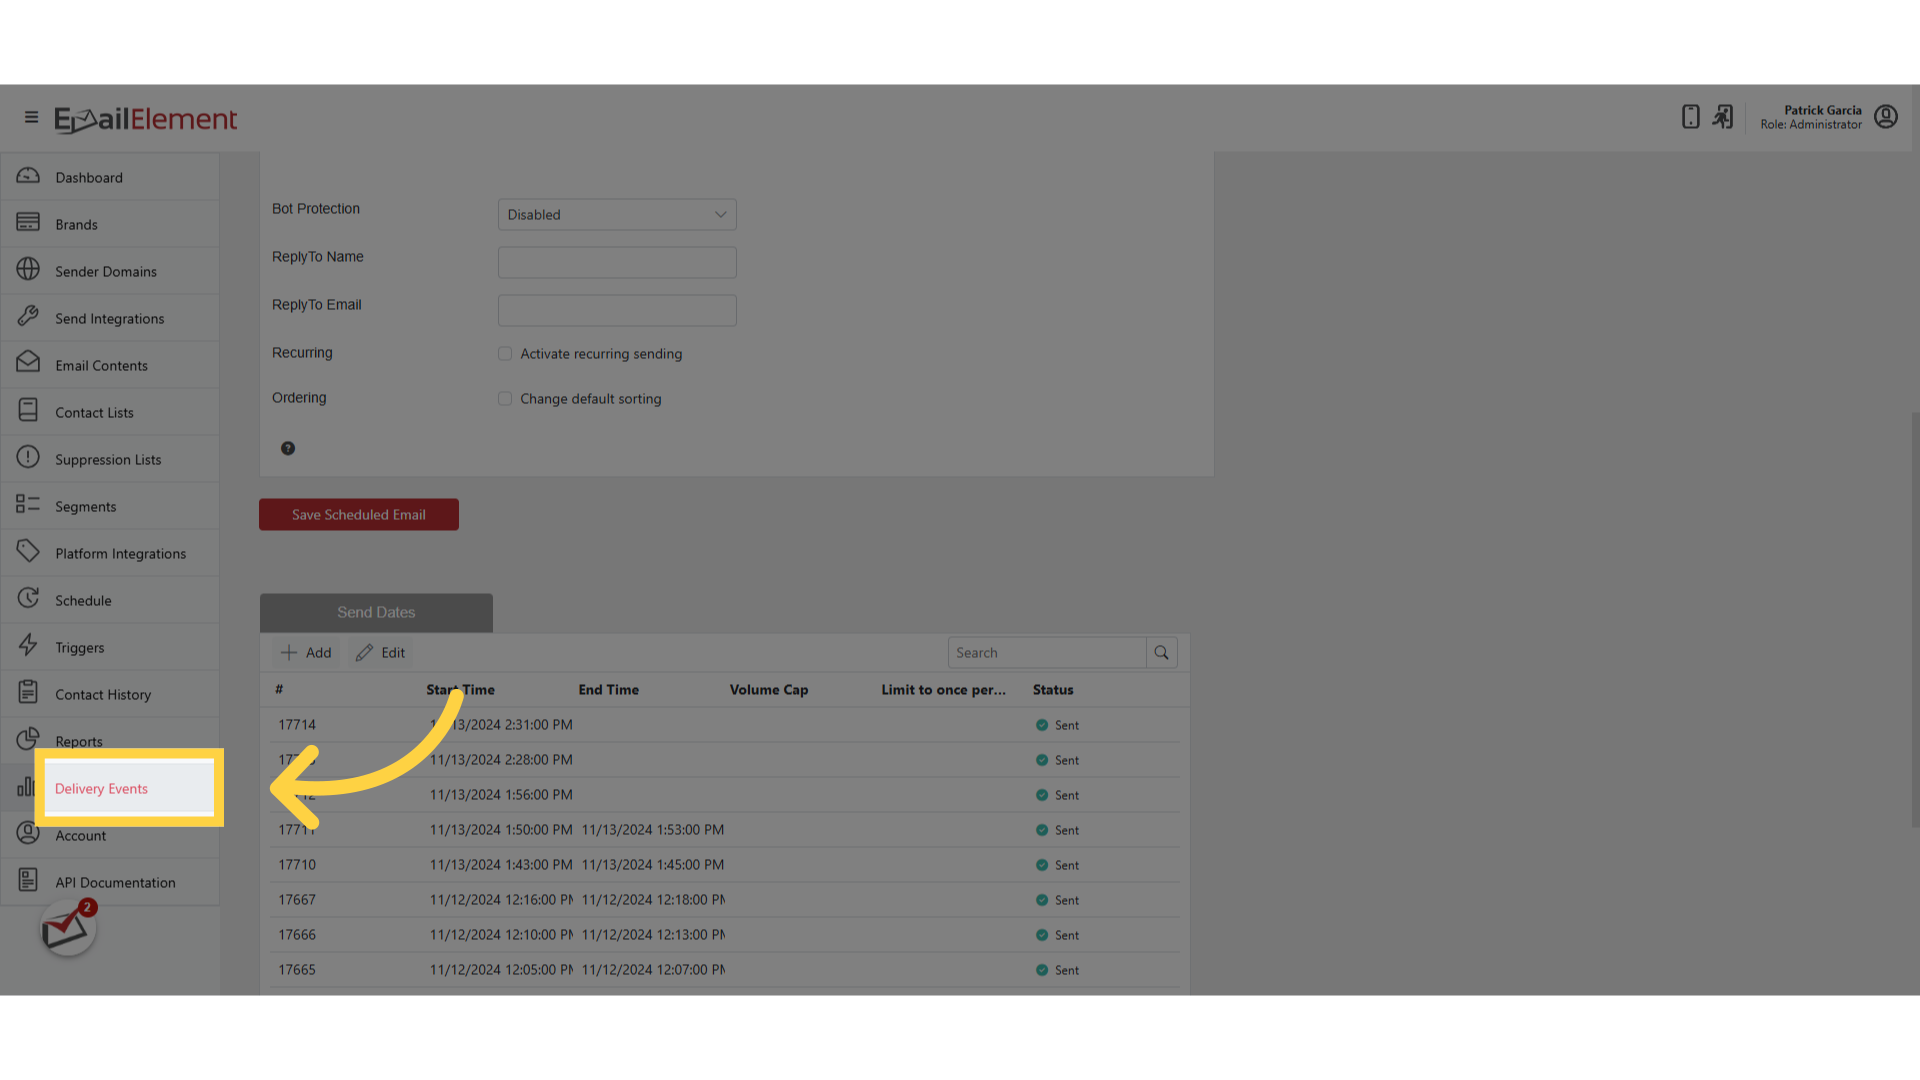
Navigate to Delivery Events from the sidebar
The default view shows events from the last 15 minutes
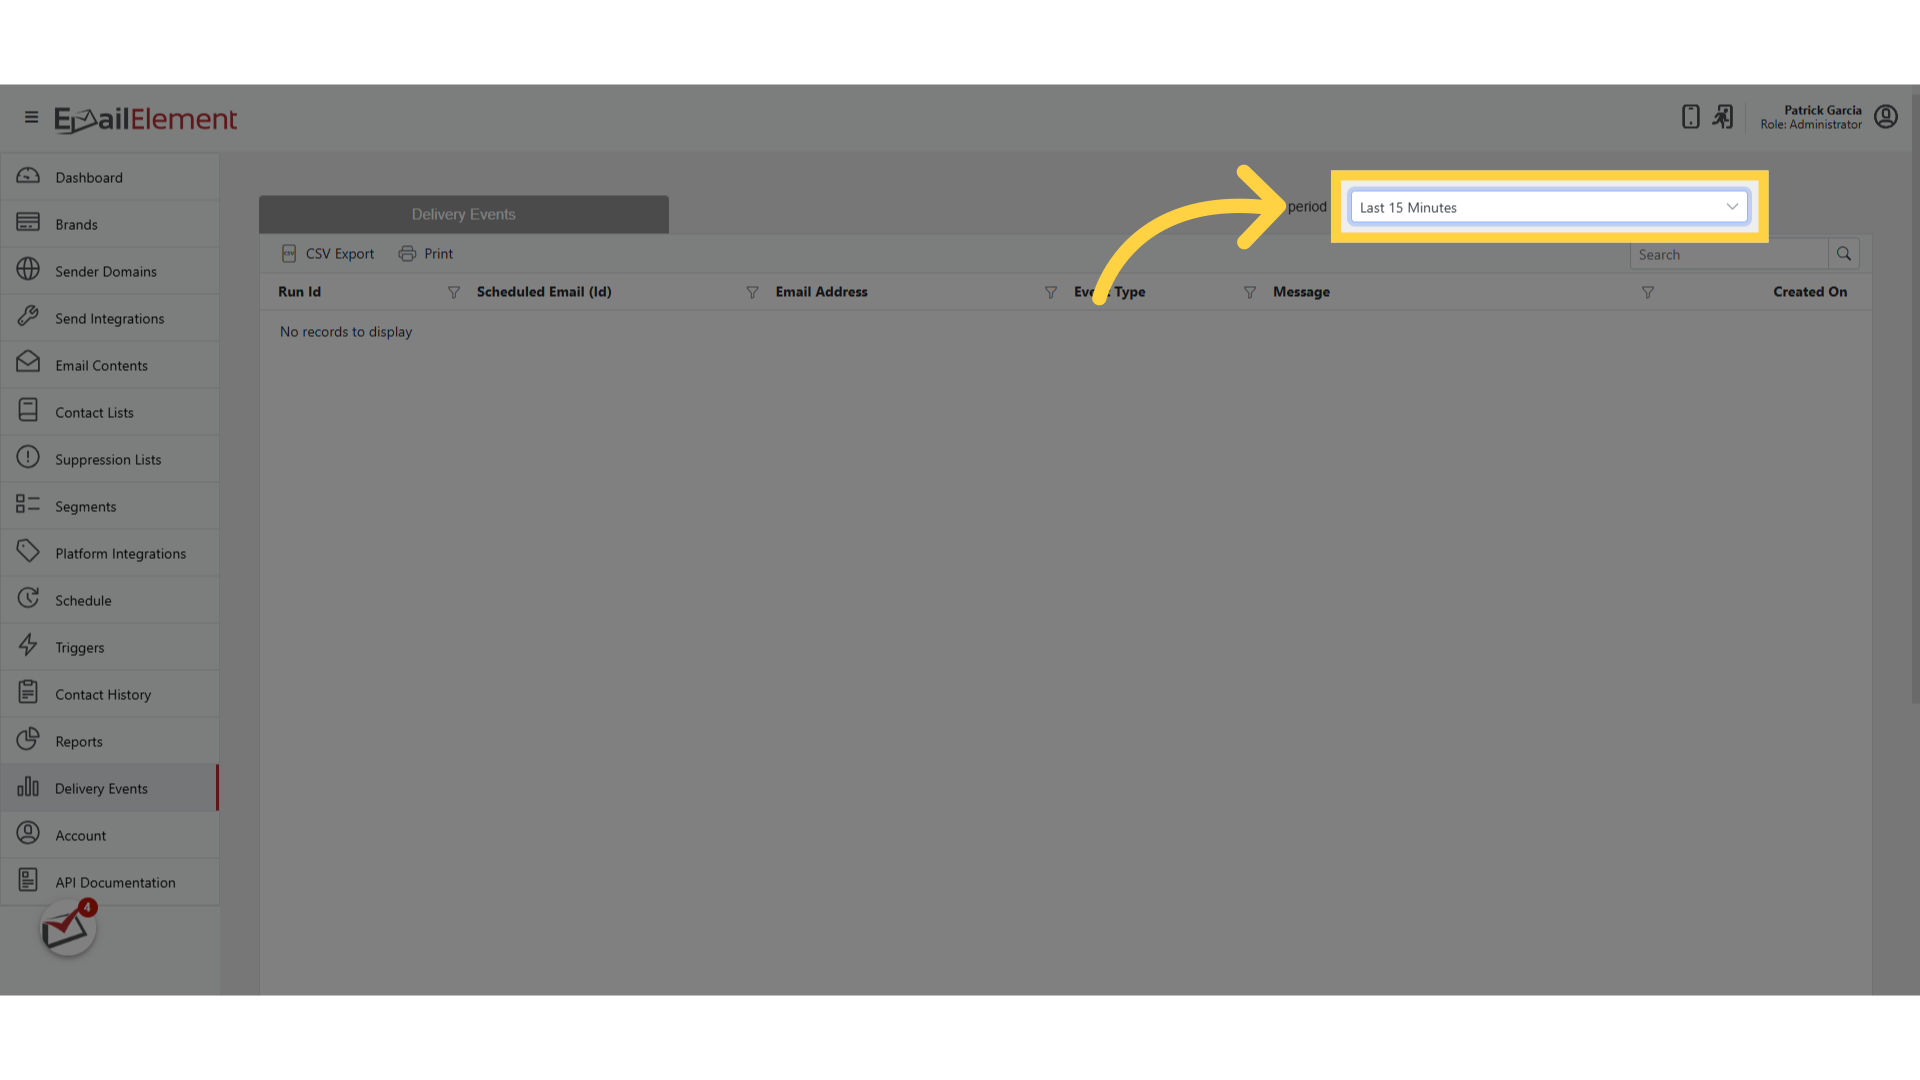
Events load in reverse chronological order (newest first)
Step 2: Adjust the Time Period
Click the Choose a period dropdown at the top
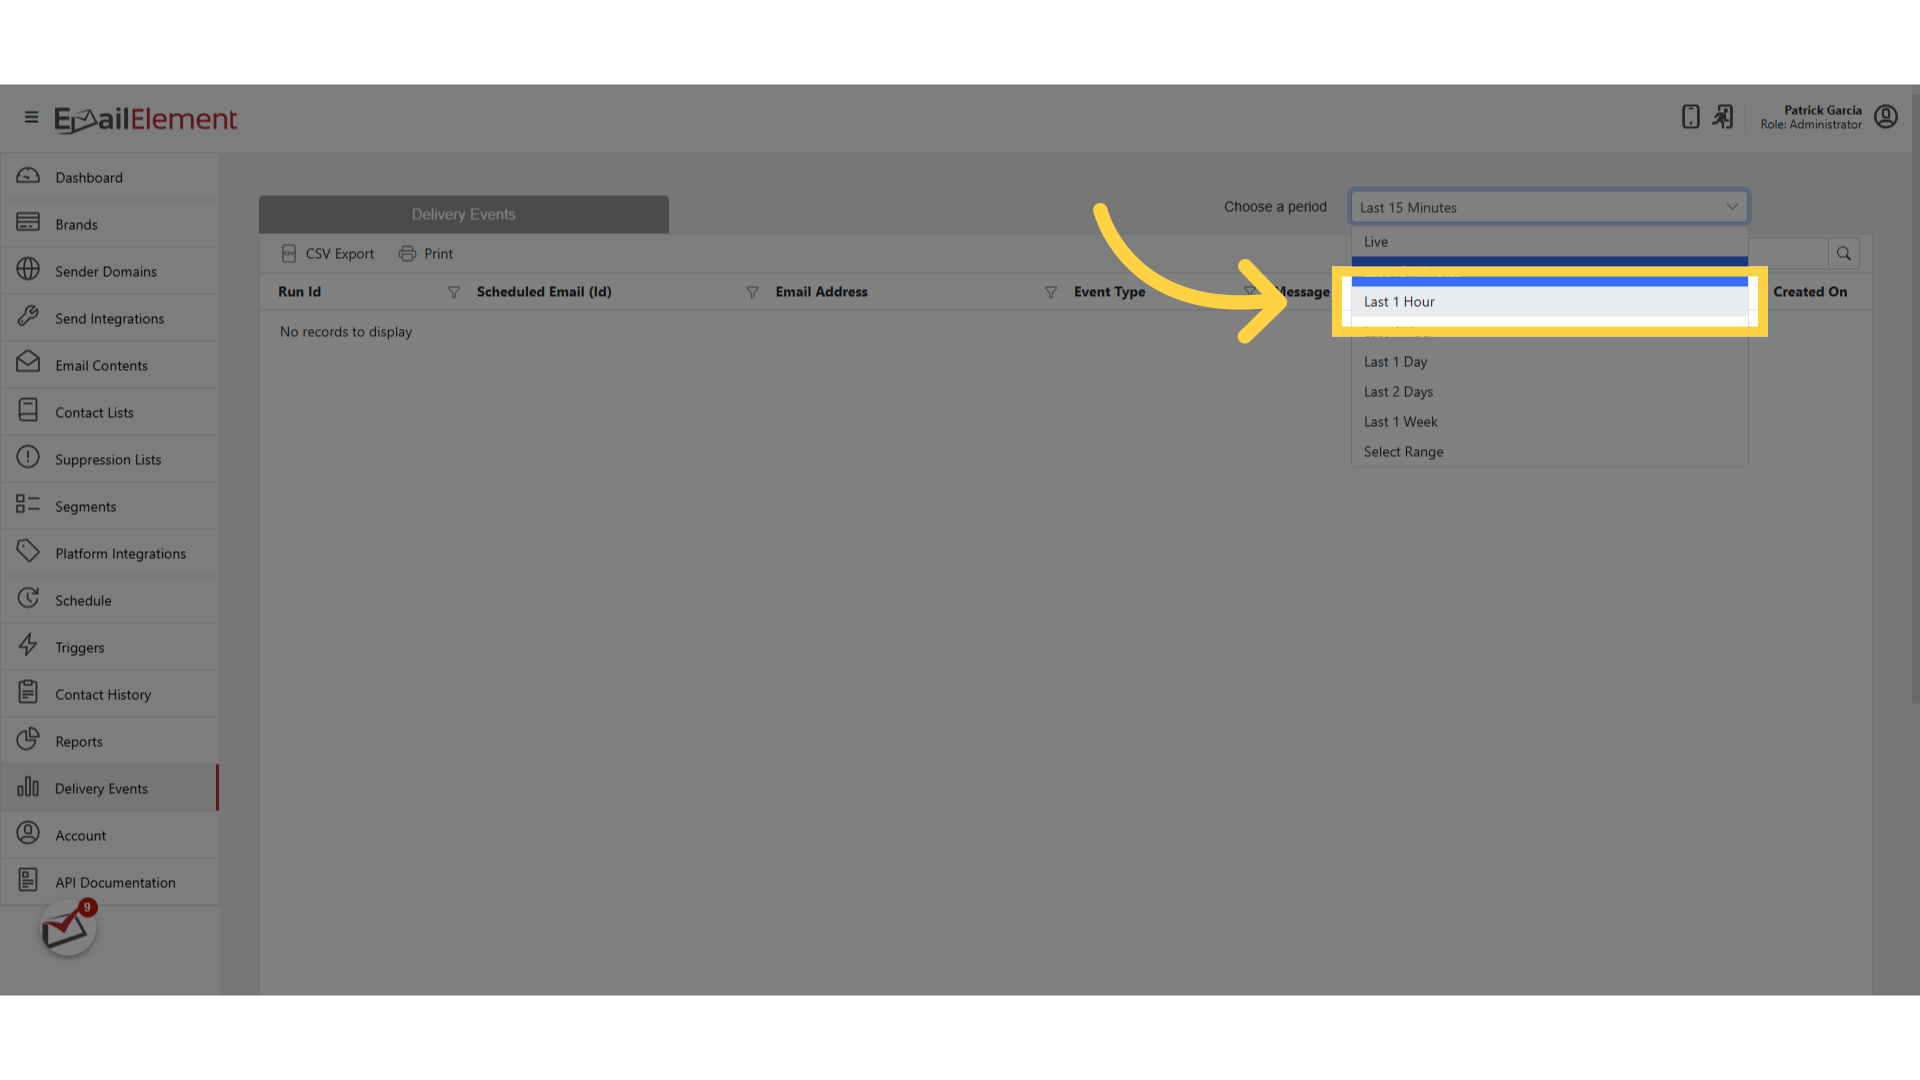
Select a preset range:
Last 15 Minutes (default)
Last 1 Hour
Last 4 Hours
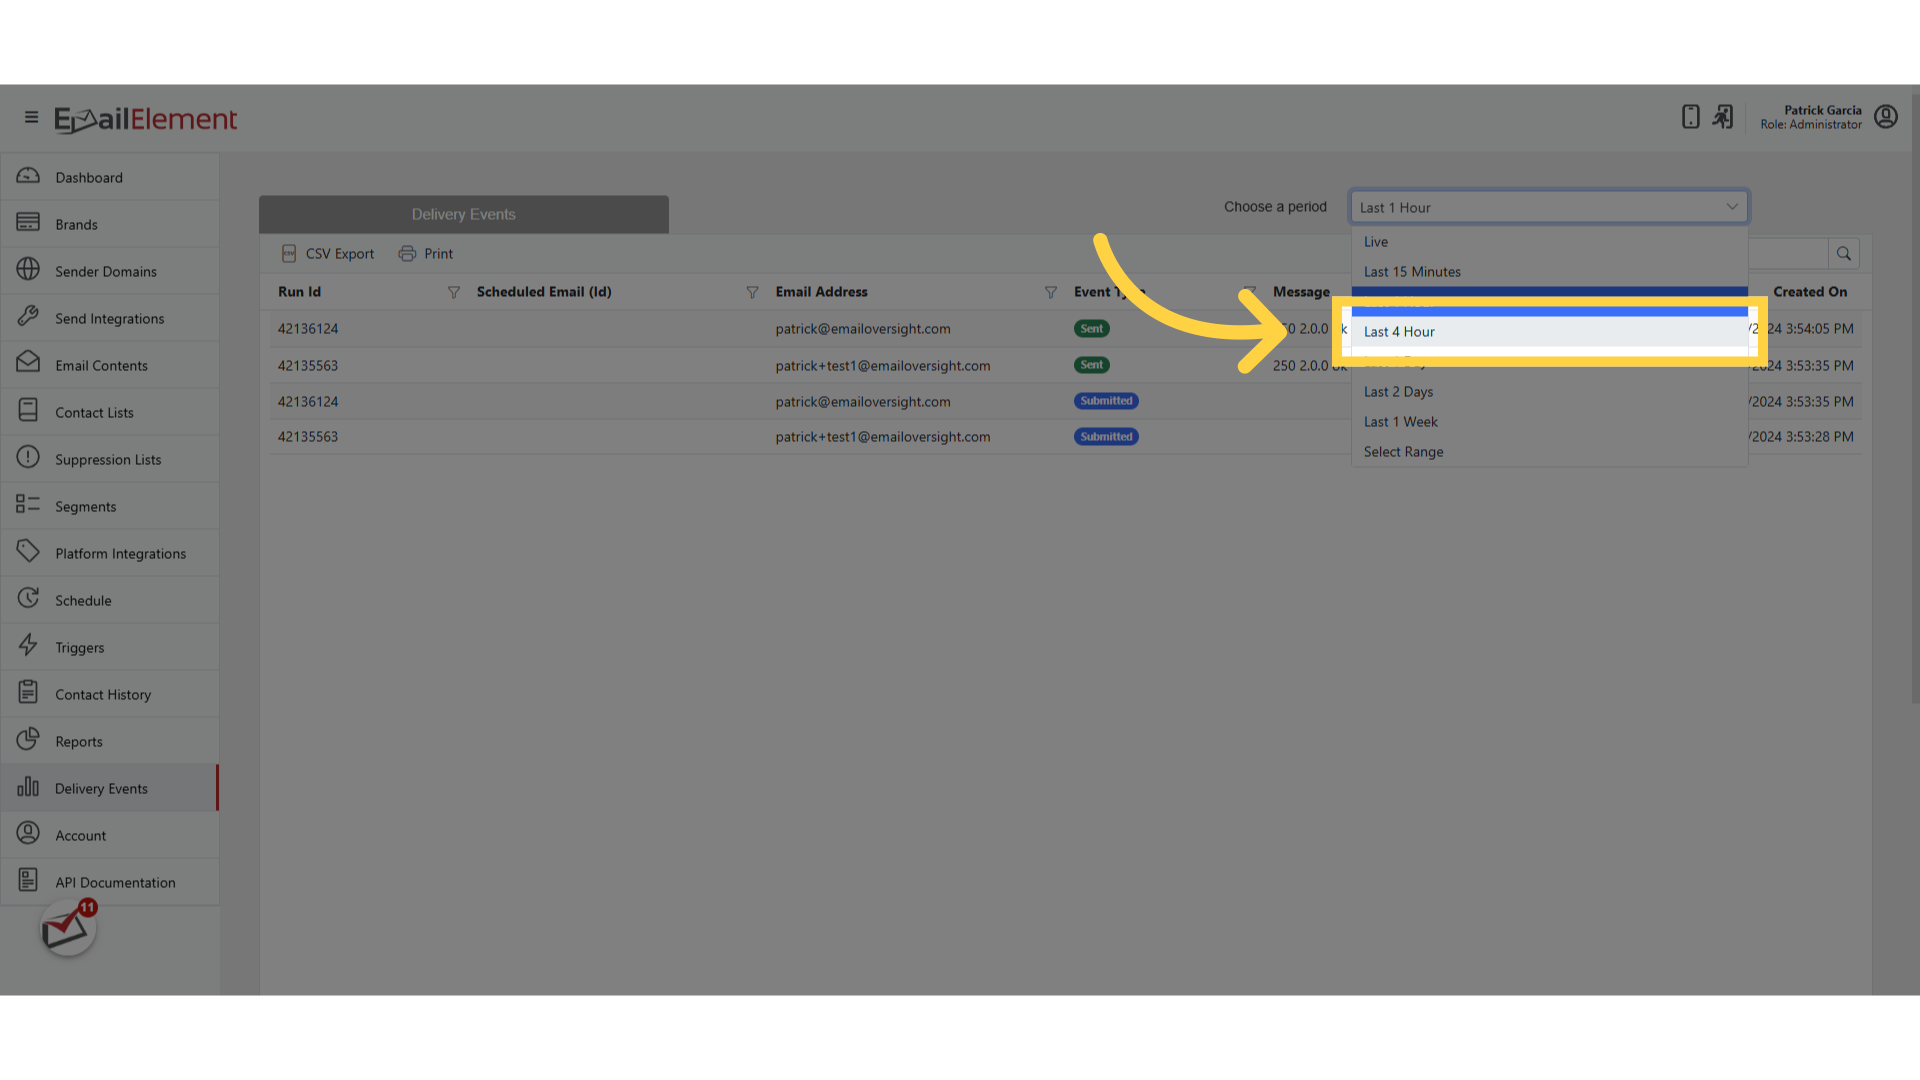
Last 24 Hours
Or select Custom to set a specific start and end date/time using the date range picker
Custom range allows up to 1 month back
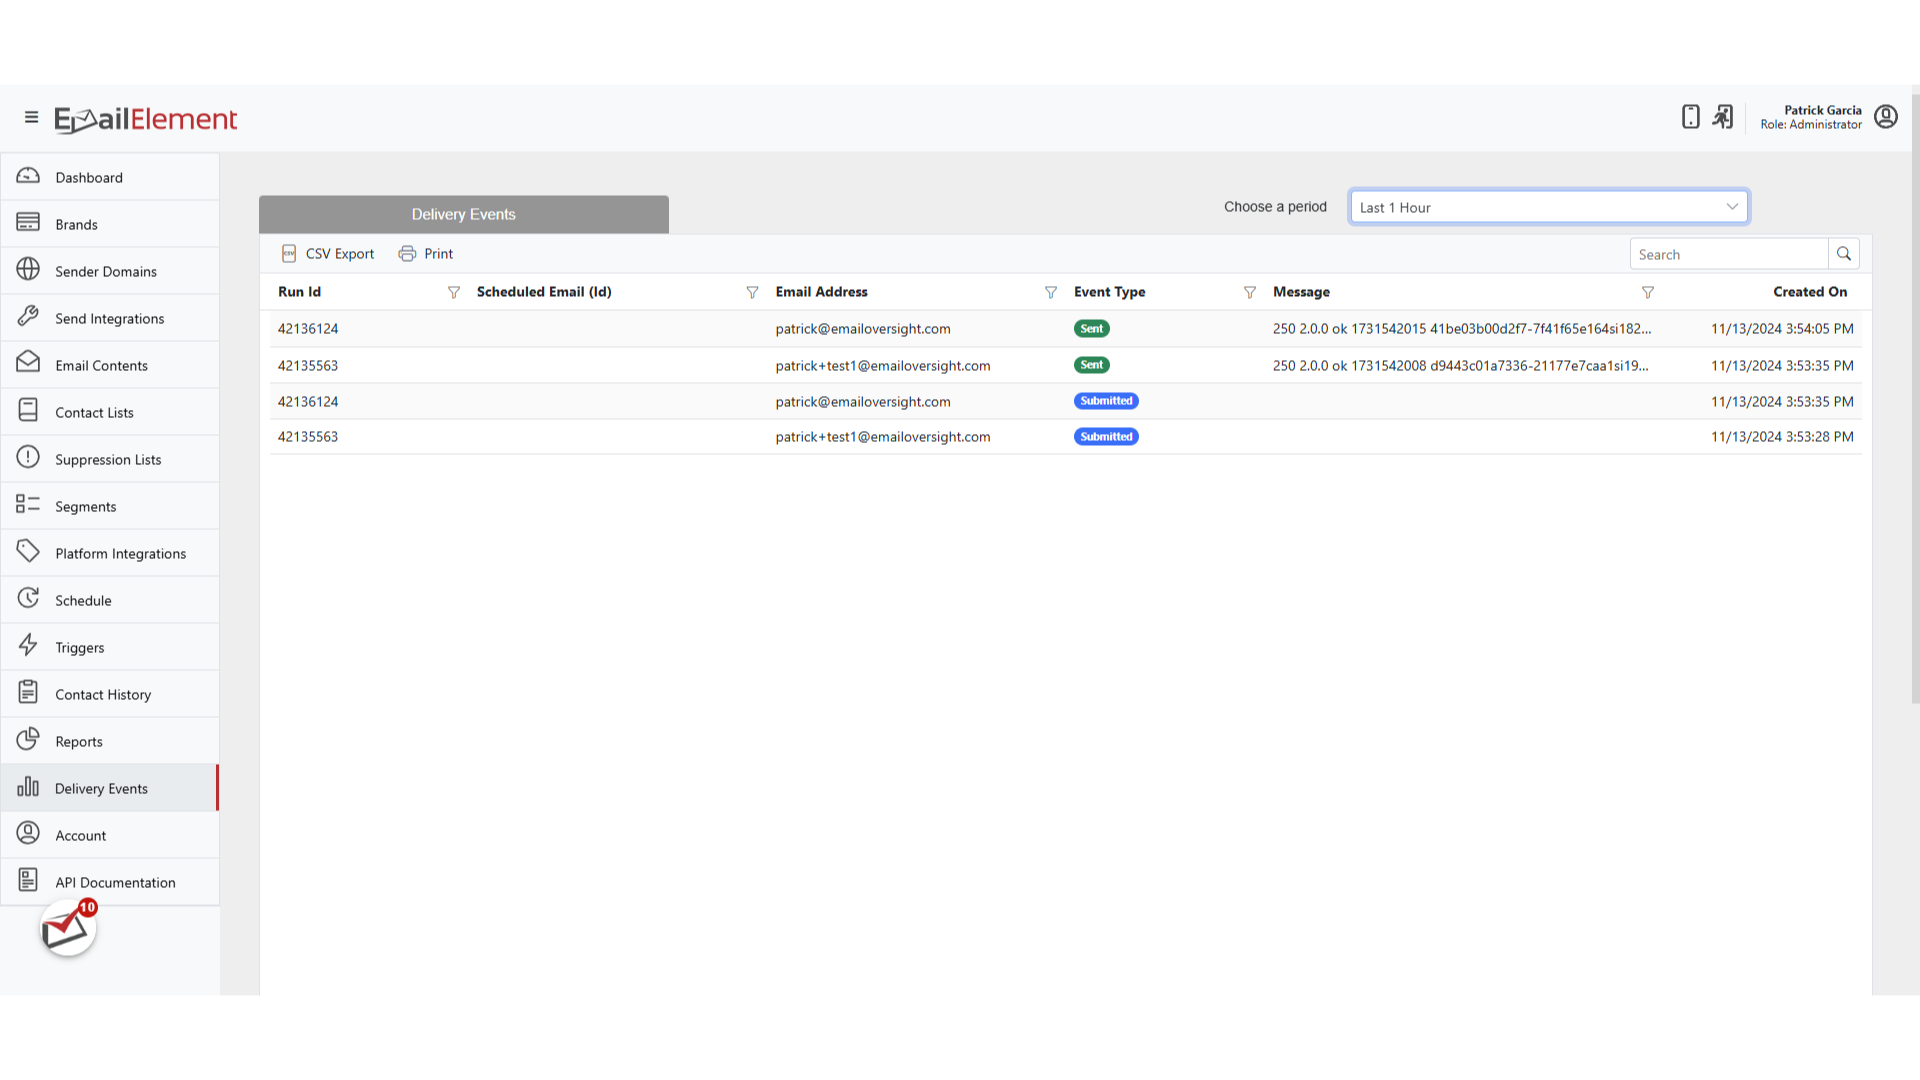
The grid refreshes to show events within the selected period
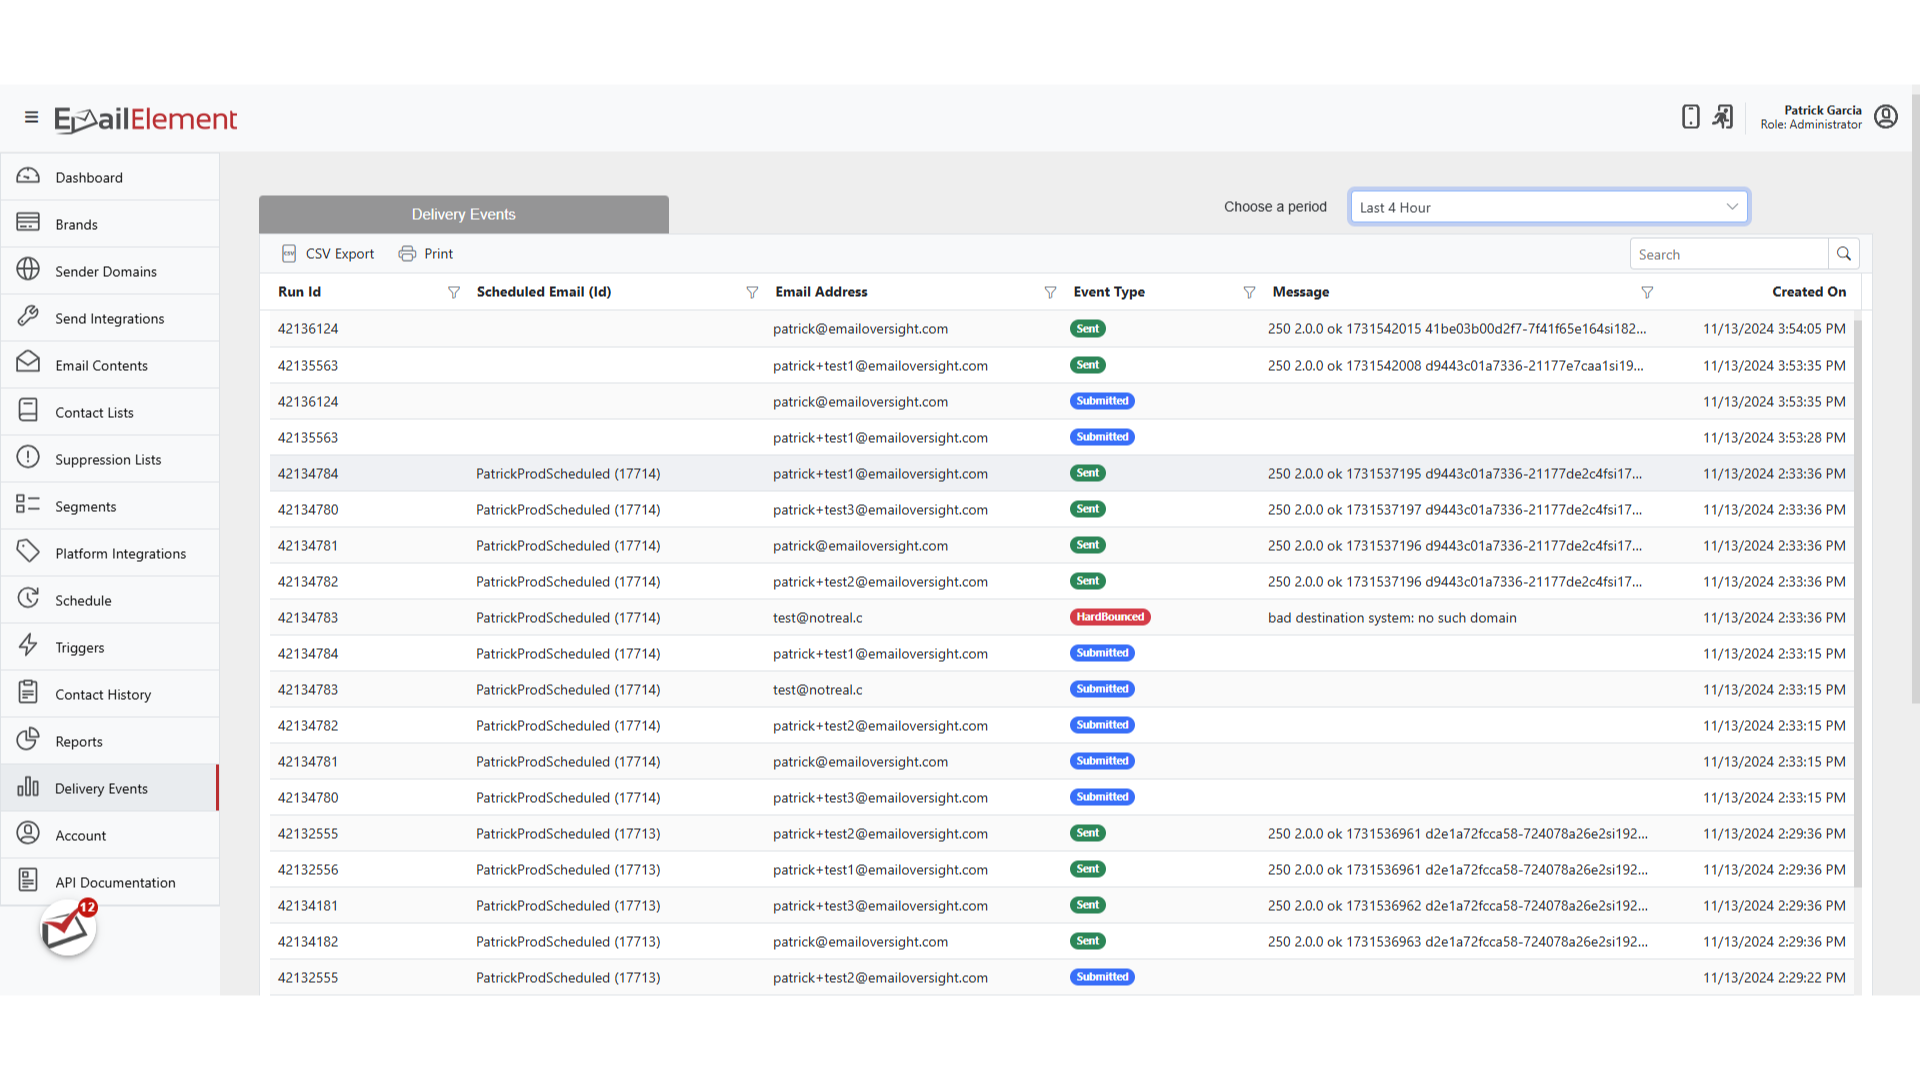
Step 3: Read Event Data
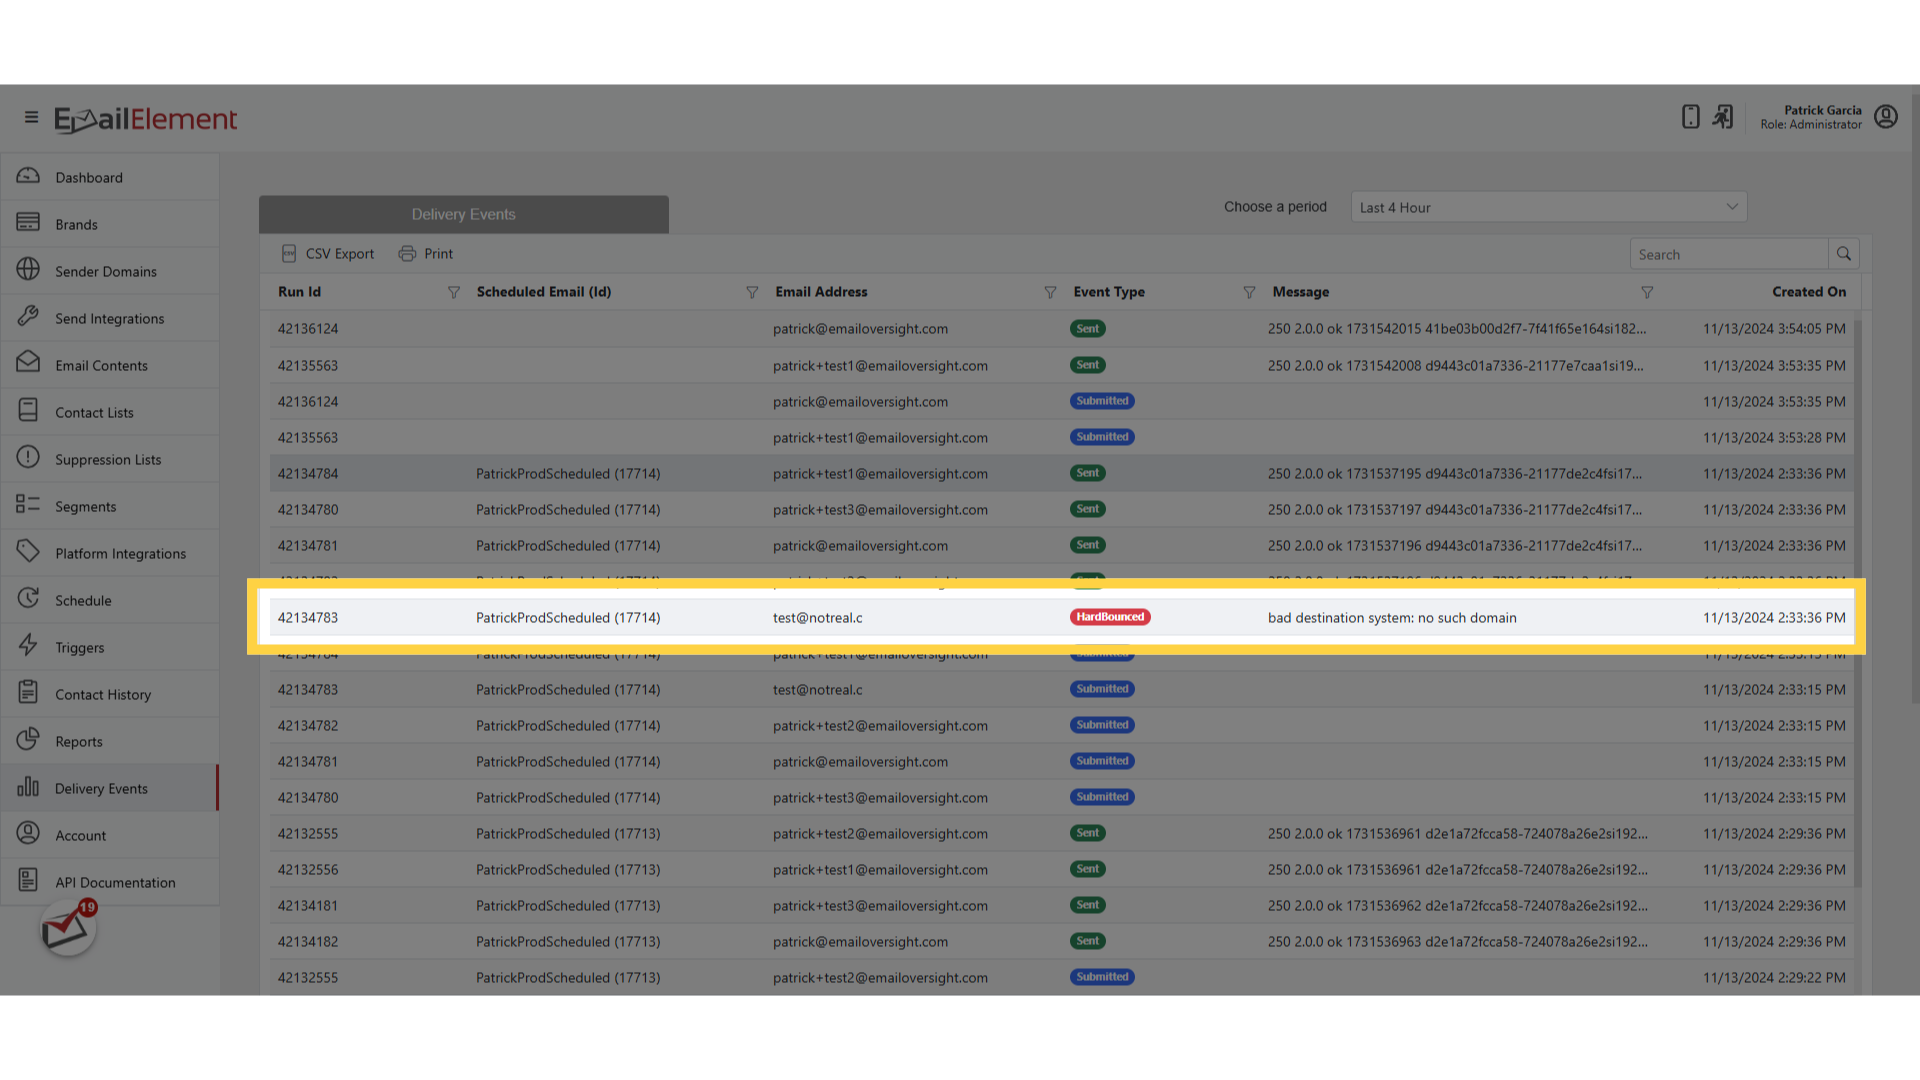
The grid displays these columns:
| Column | Description |
|---|---|
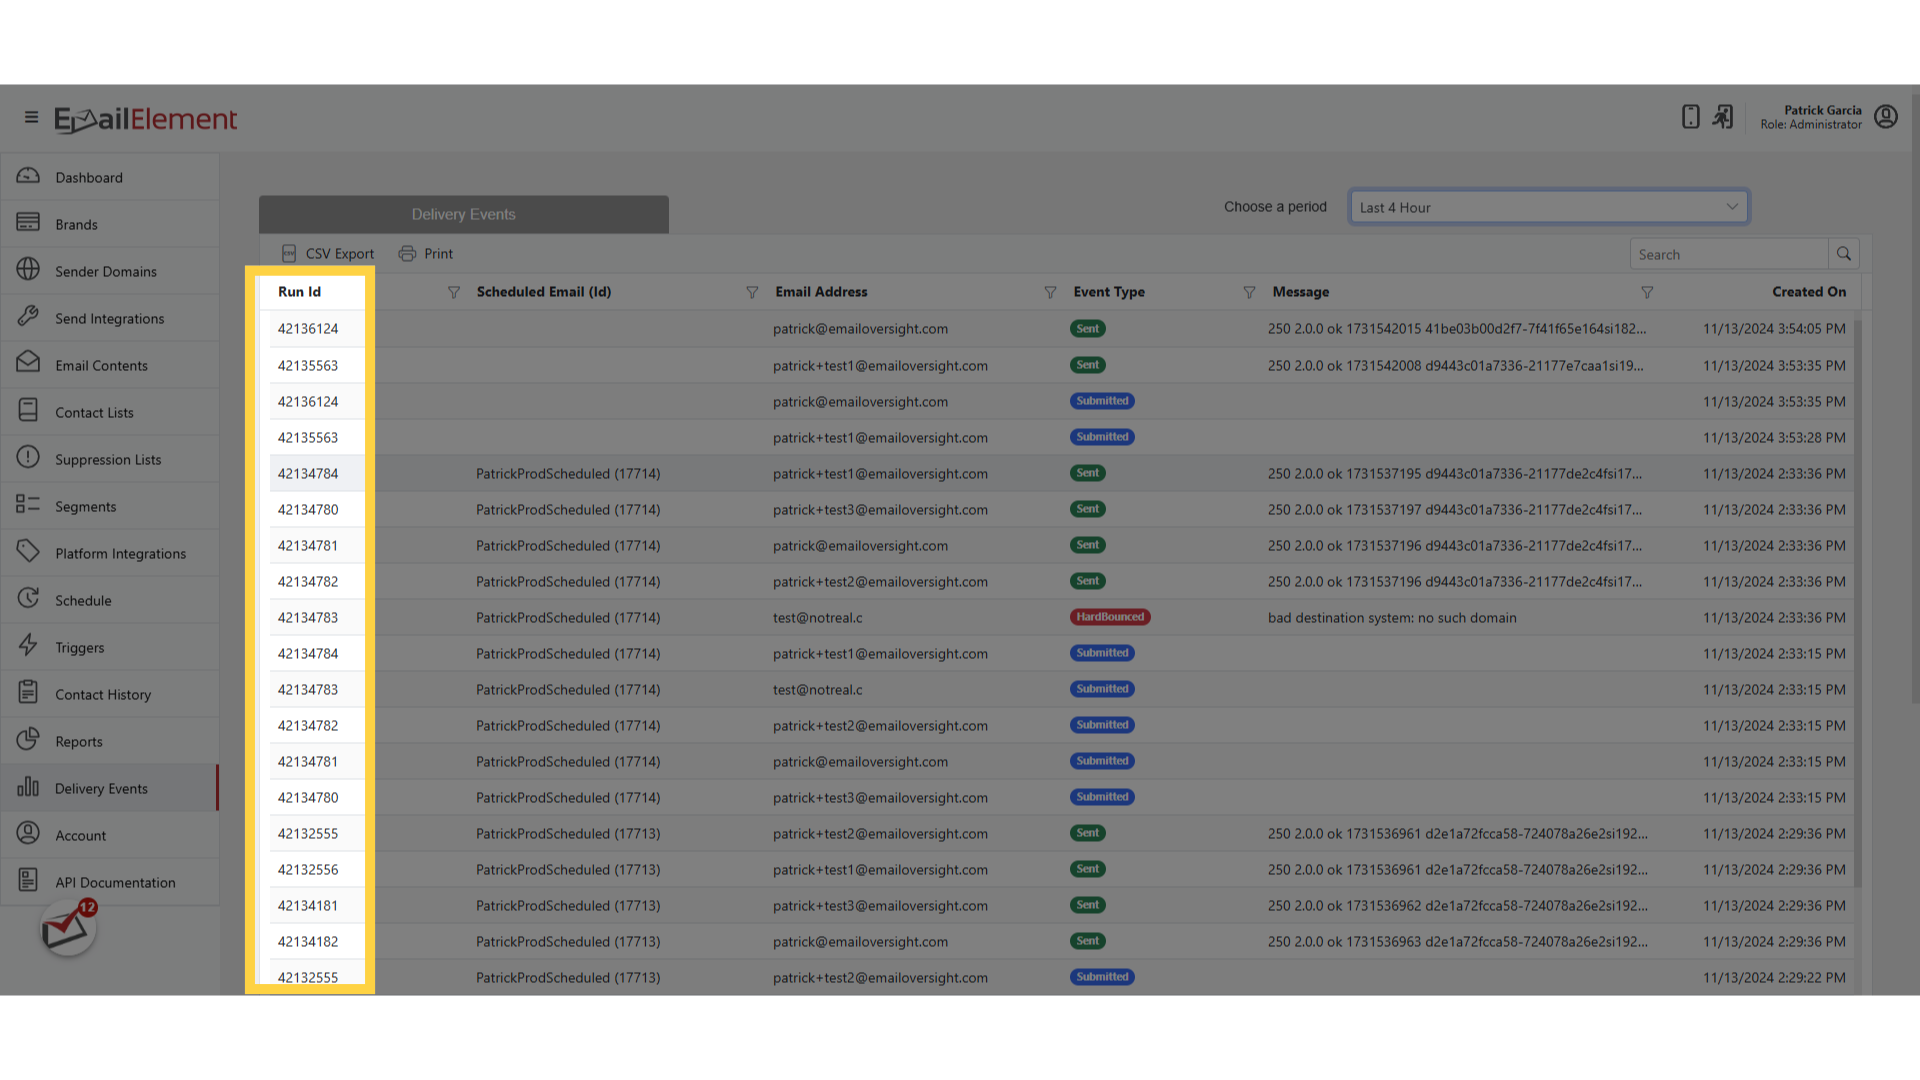
| Run Id | Unique identifier for the send run |
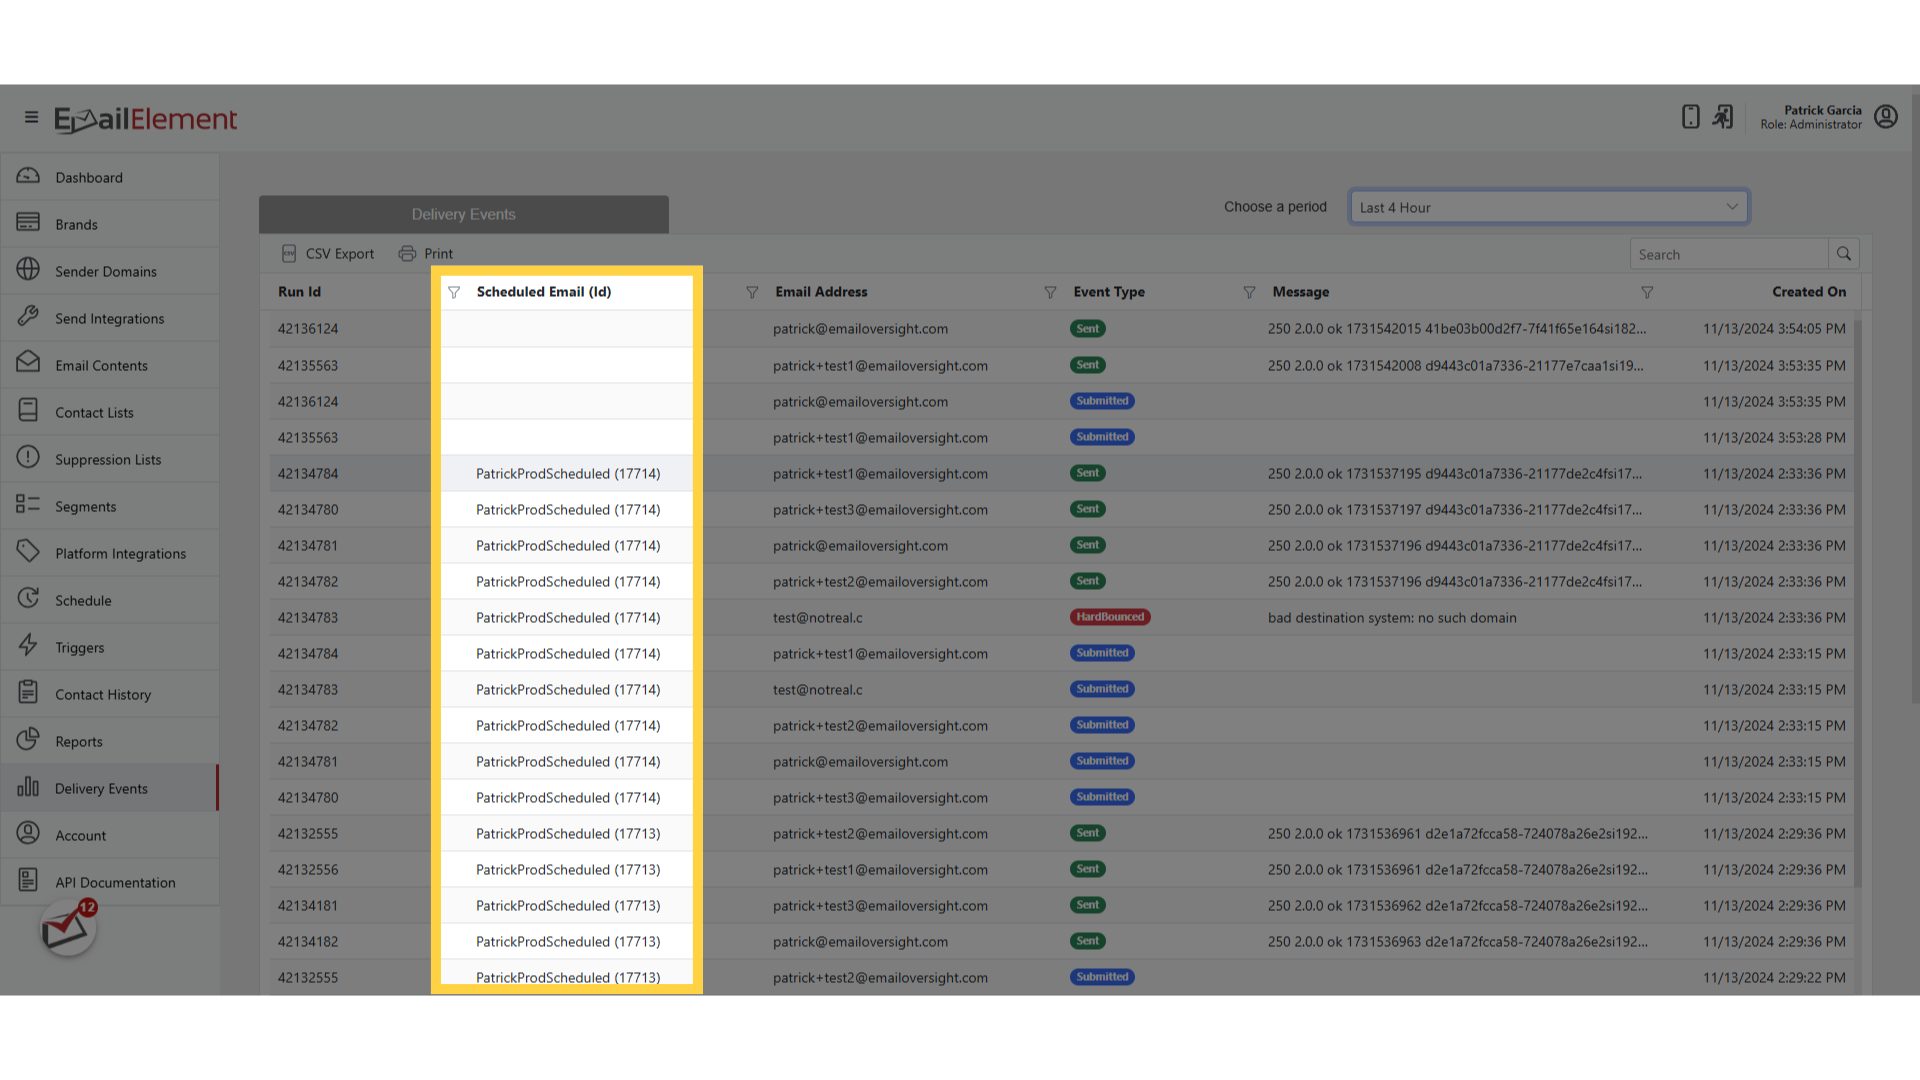
| Source | Name of the Scheduled Email, Triggered Sequence, or Transactional Relay that initiated the send |
| Send Integration | Name of the Send Integration used |
| Email Domain Group | Recipient domain grouping (e.g., Google, Yahoo, Microsoft) |
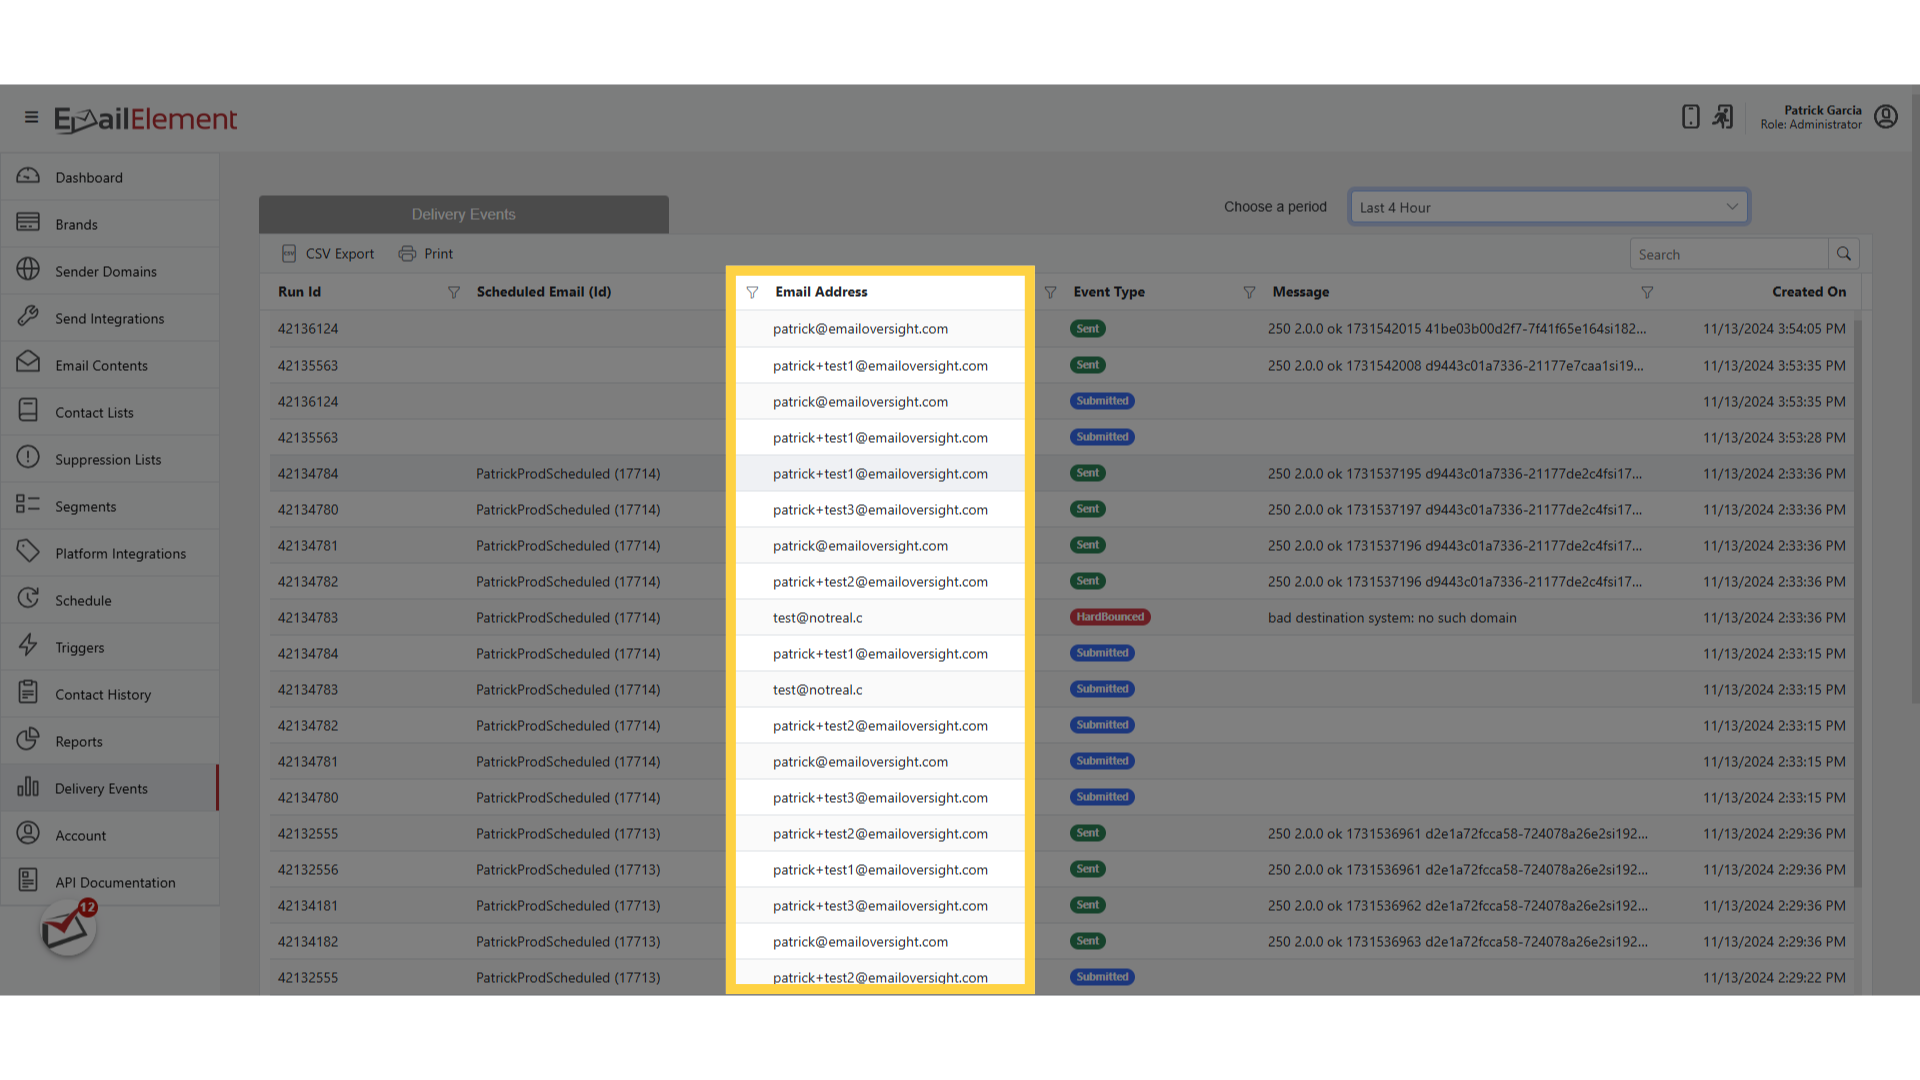
| Email Address | Recipient email address |
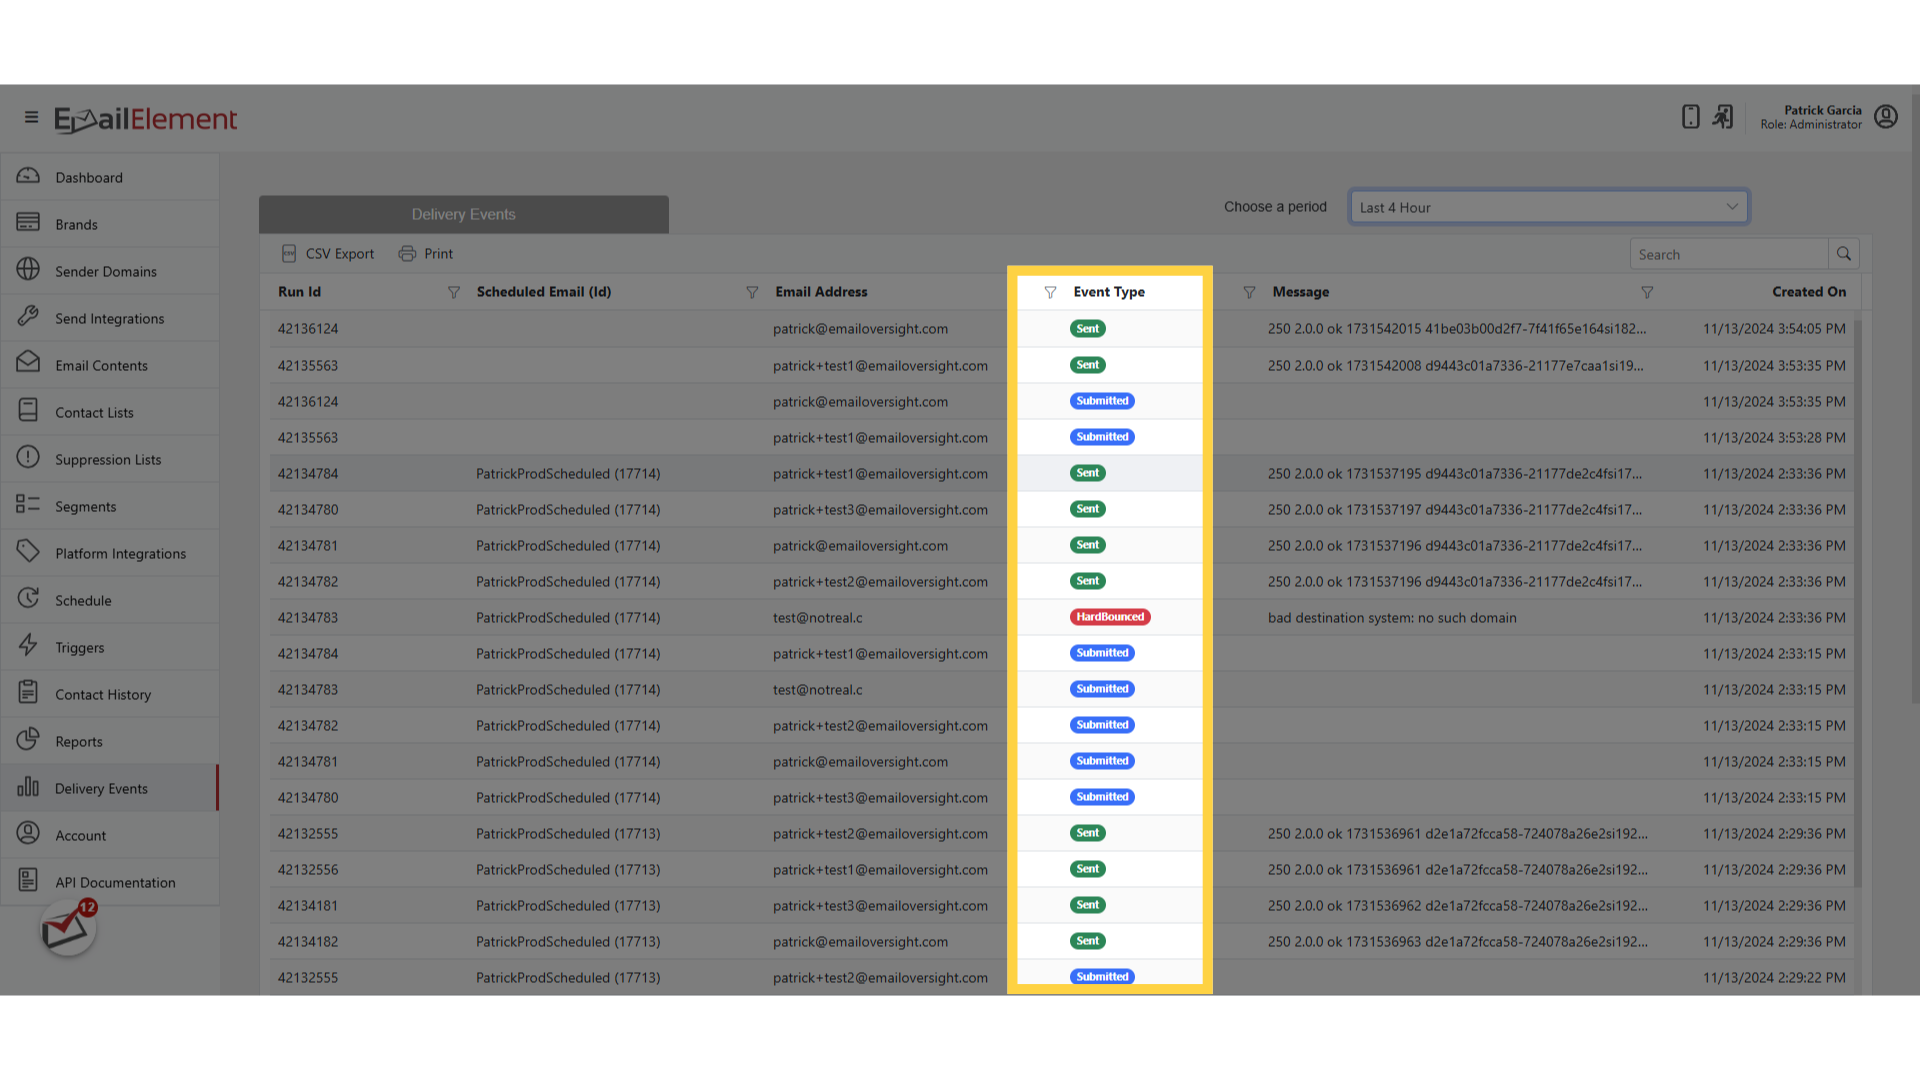
| Event Type | The delivery event type (color-coded badge): Submitted, Sent, HardBounced, SoftBounced, Failed, etc. |
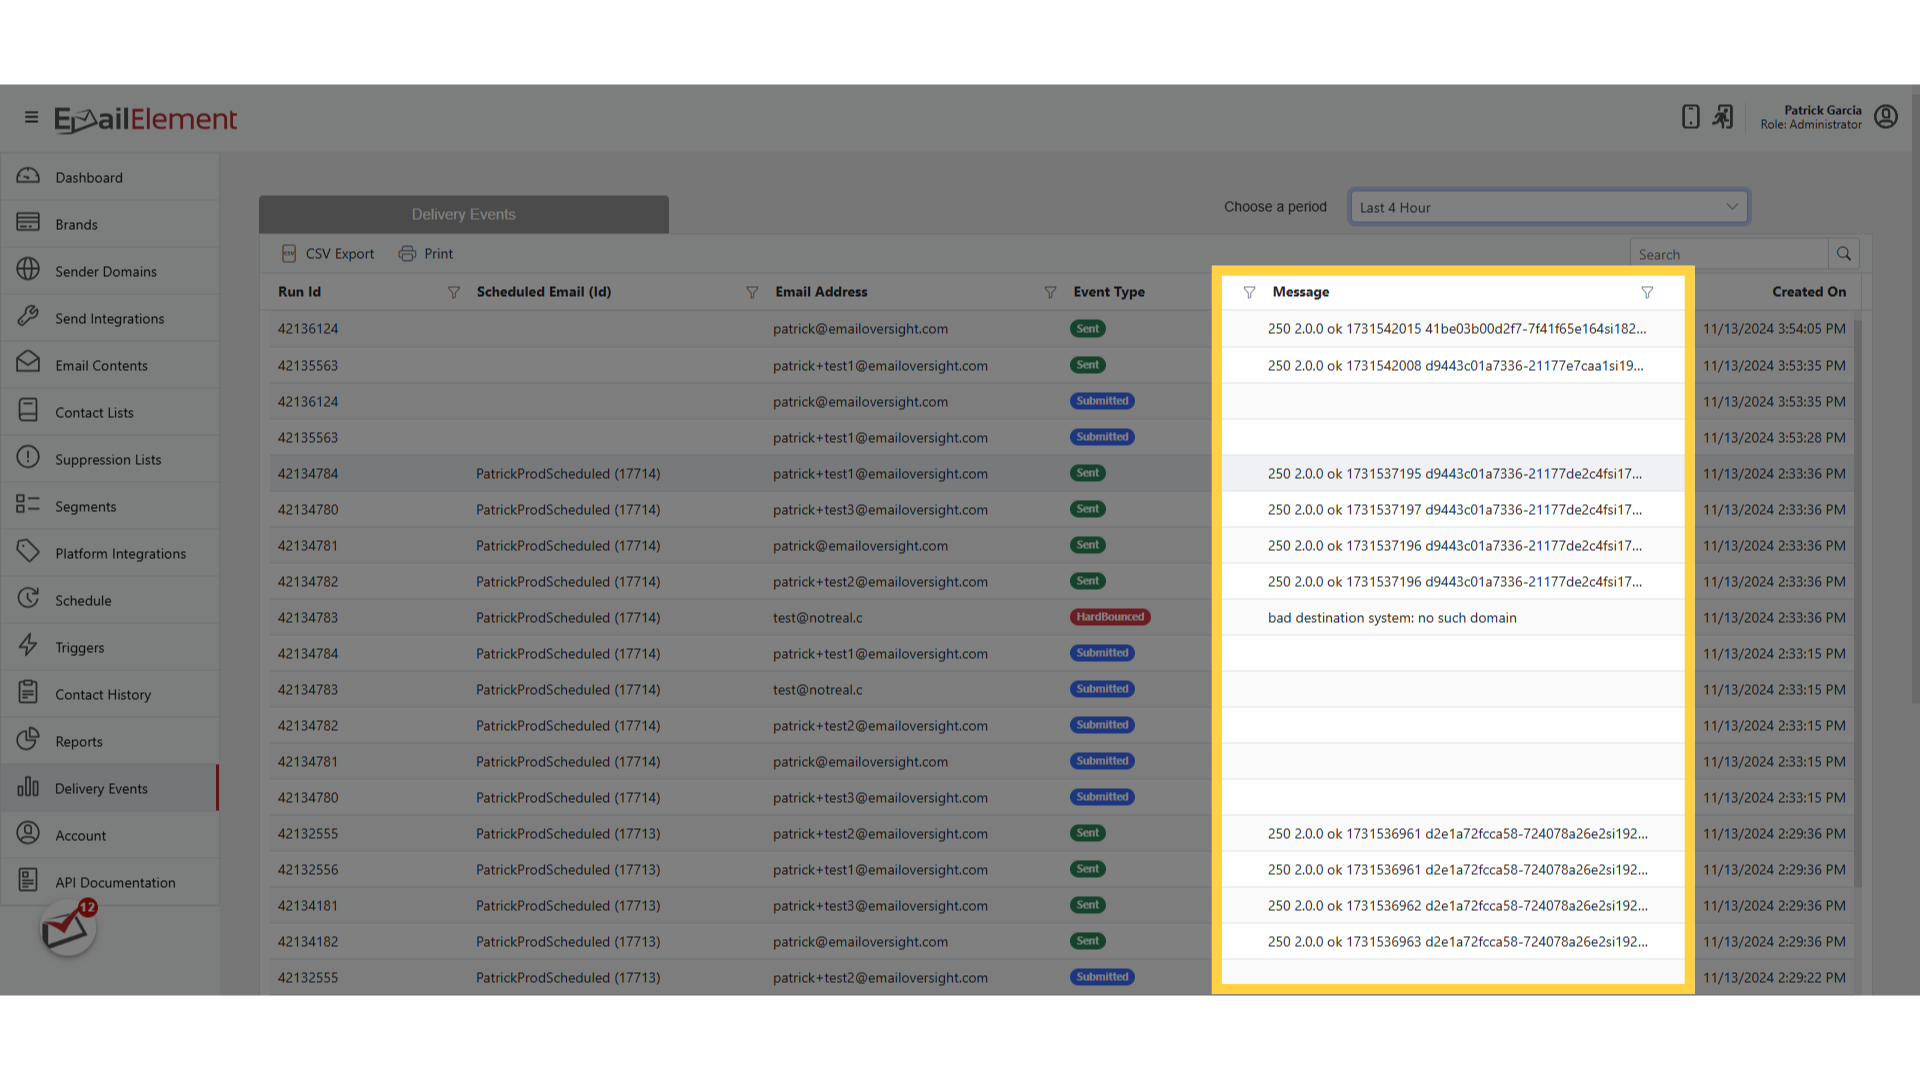
| Message | Additional details (error message for bounces/failures) |
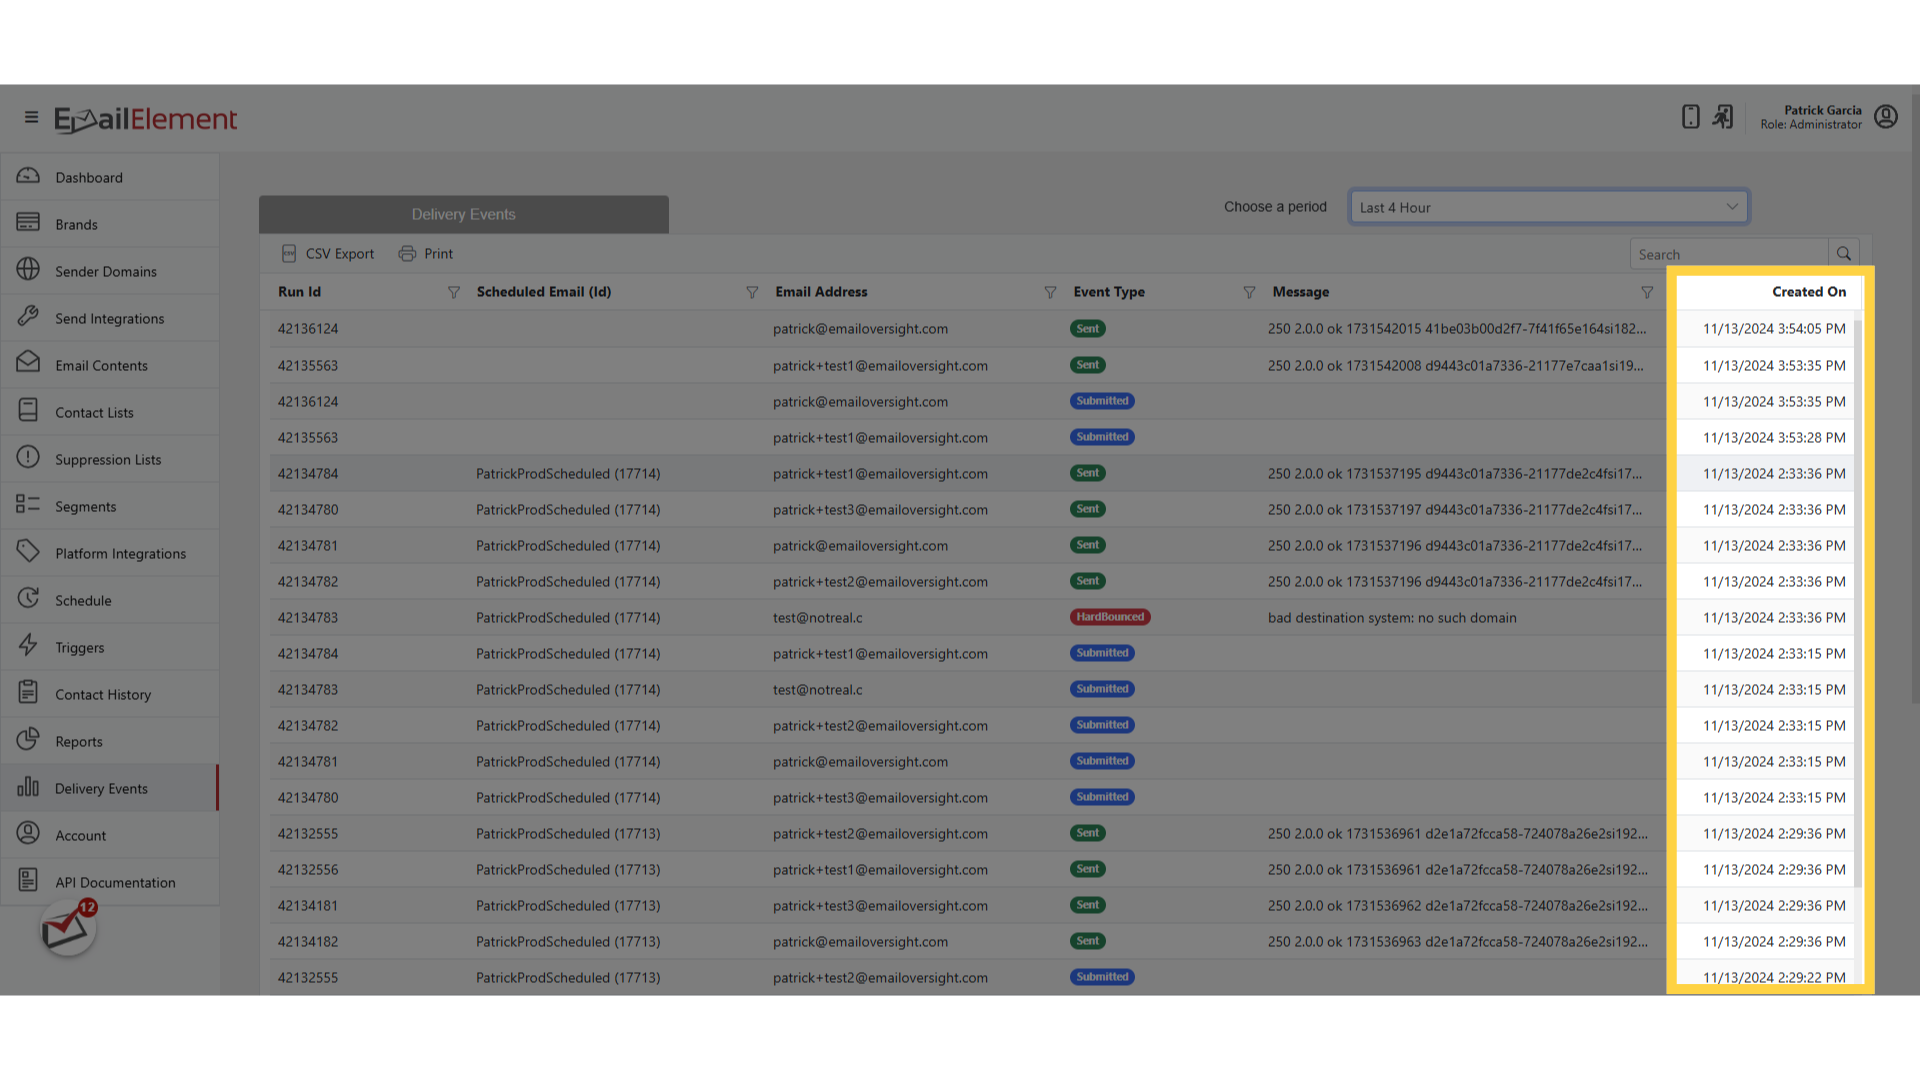
| Created On | Timestamp of when the event occurred (shown in your account timezone) |
Step 4: View Event Details
Click any event row to open the Event Details dialog
The detail view shows all grid columns plus additional fields:
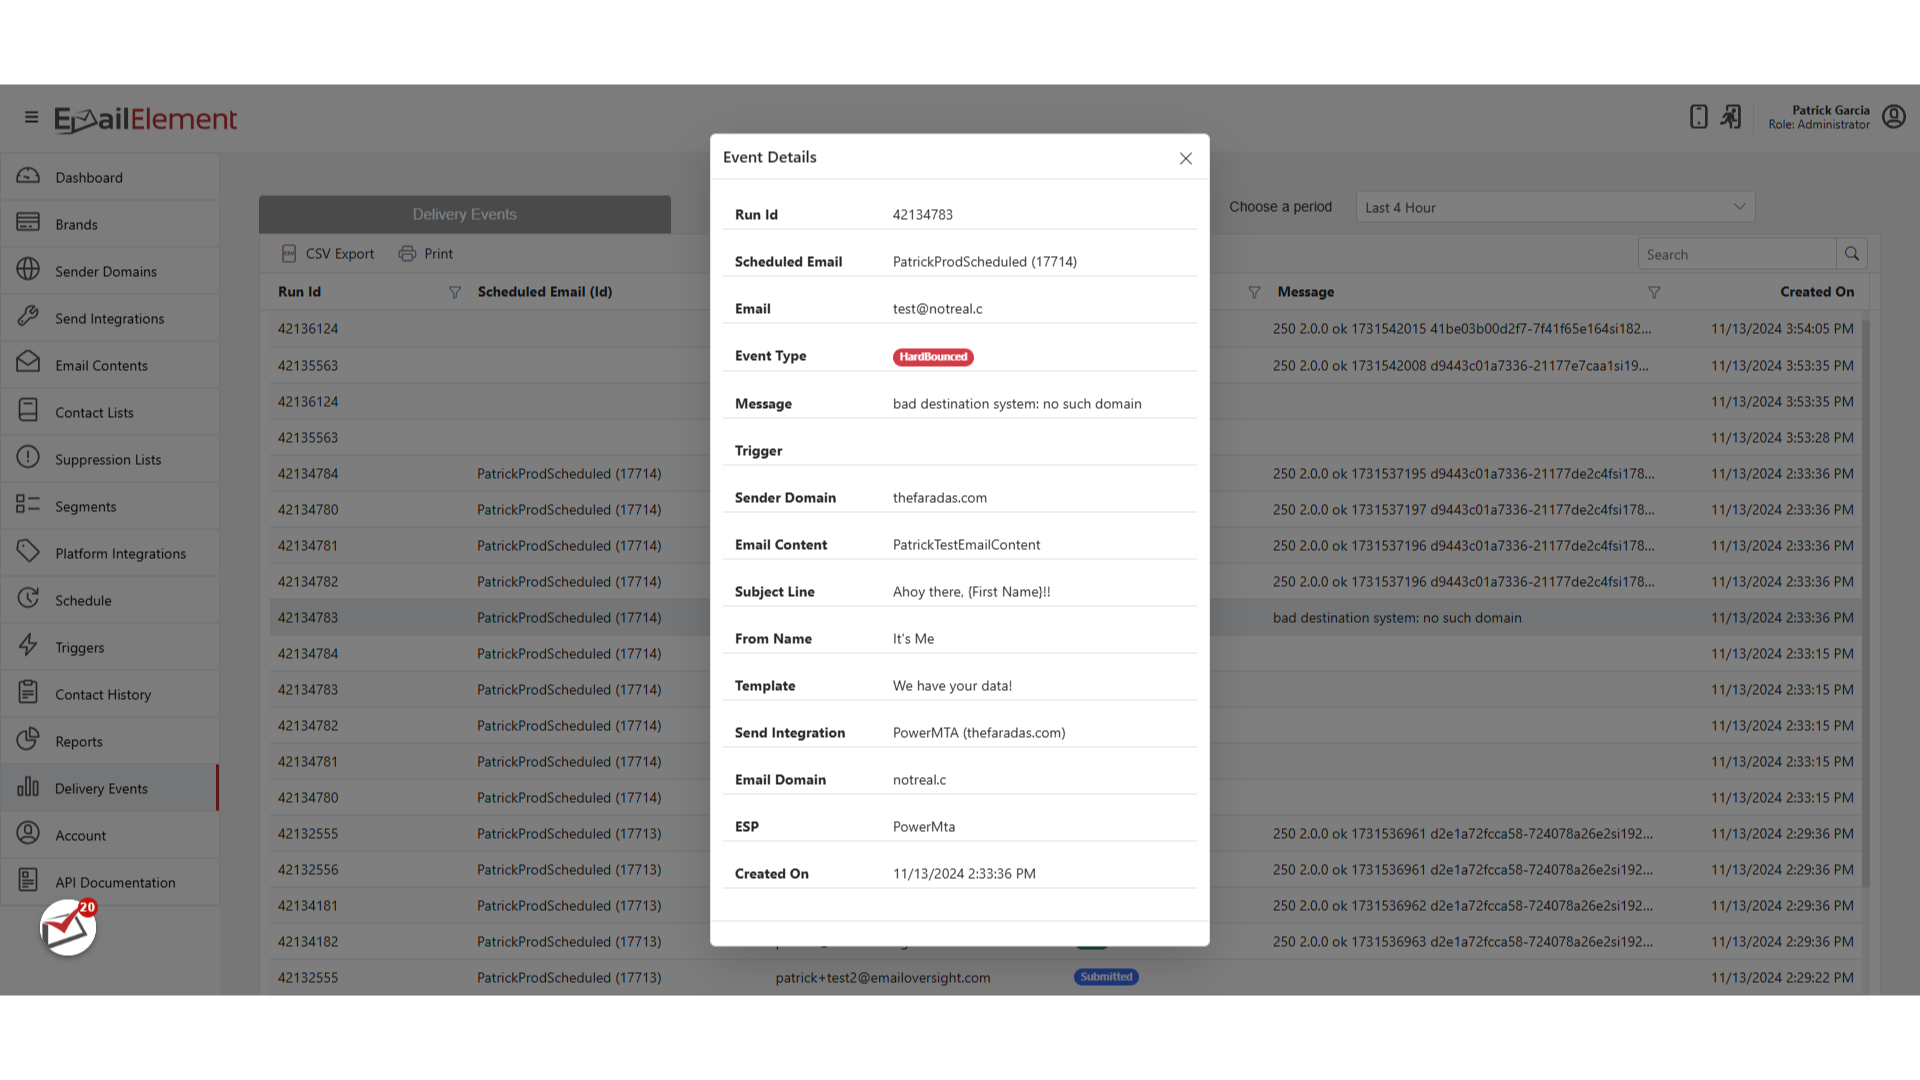
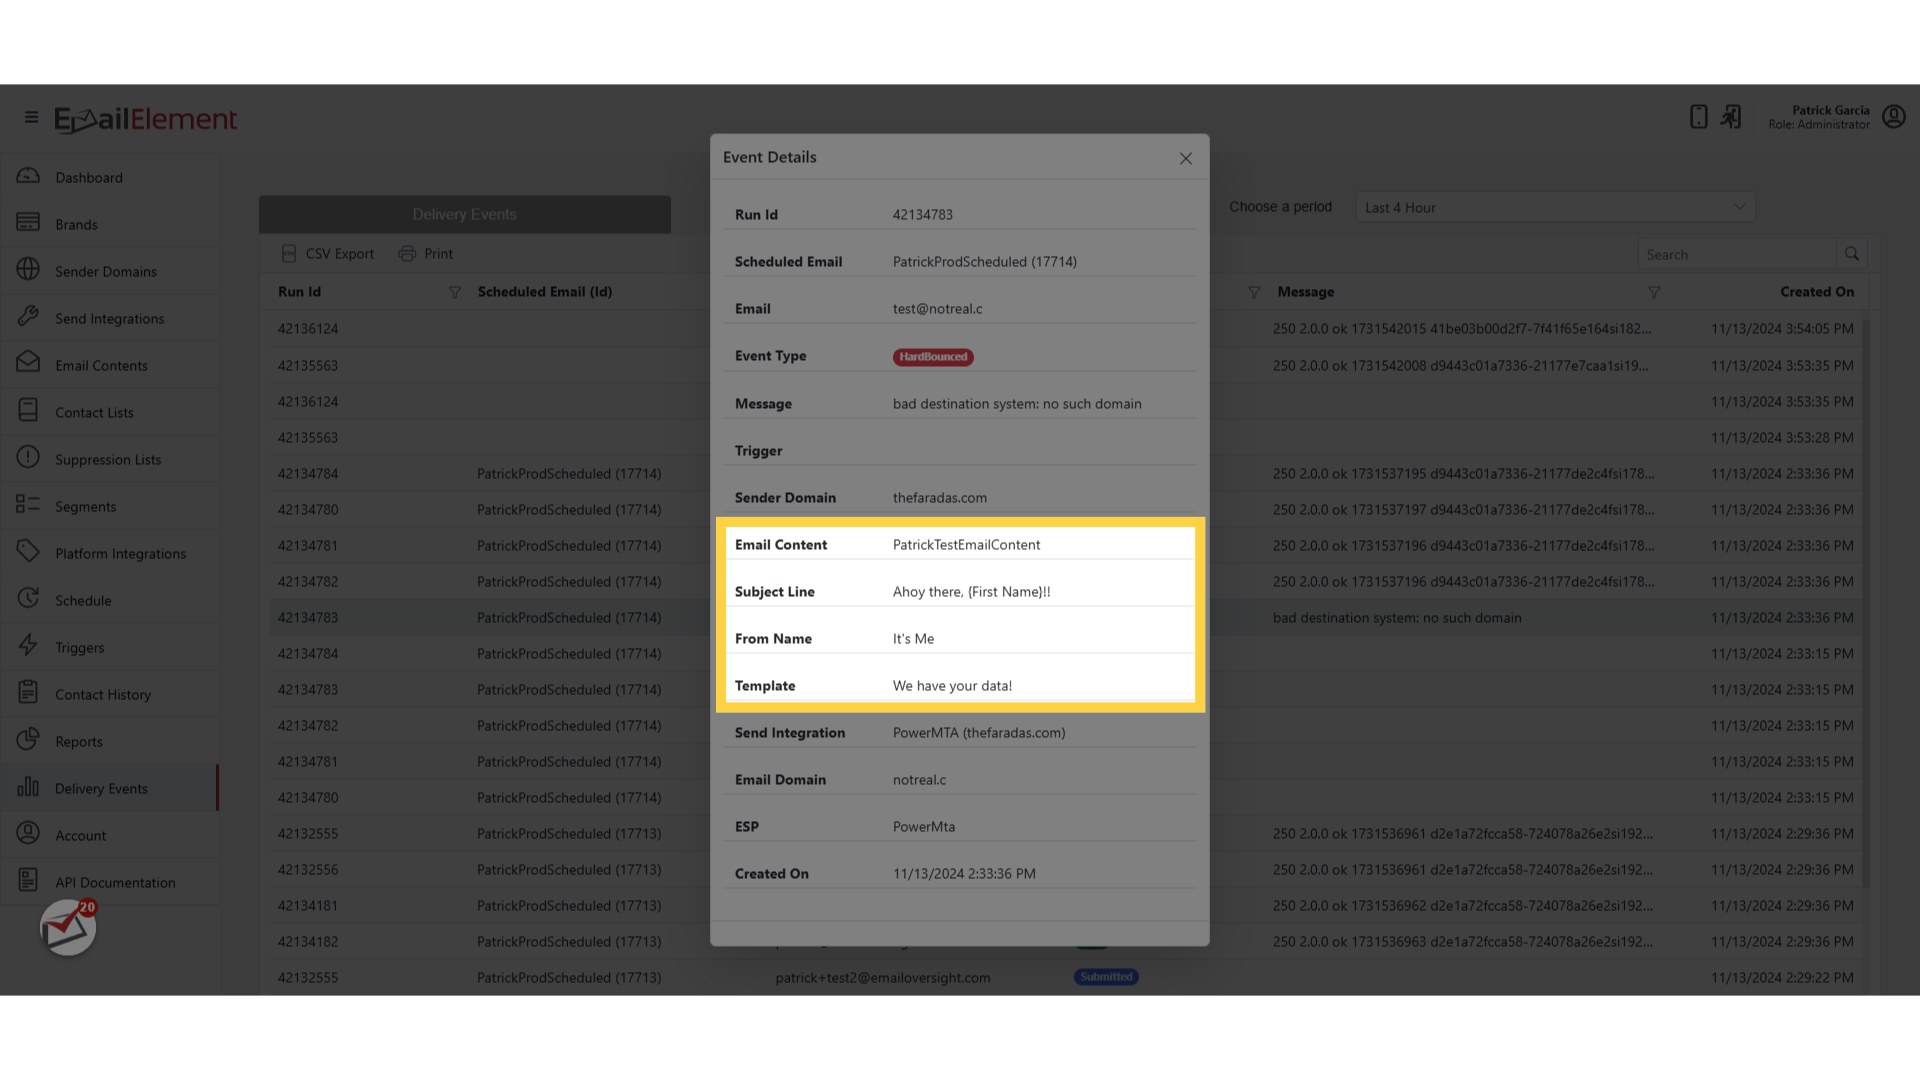
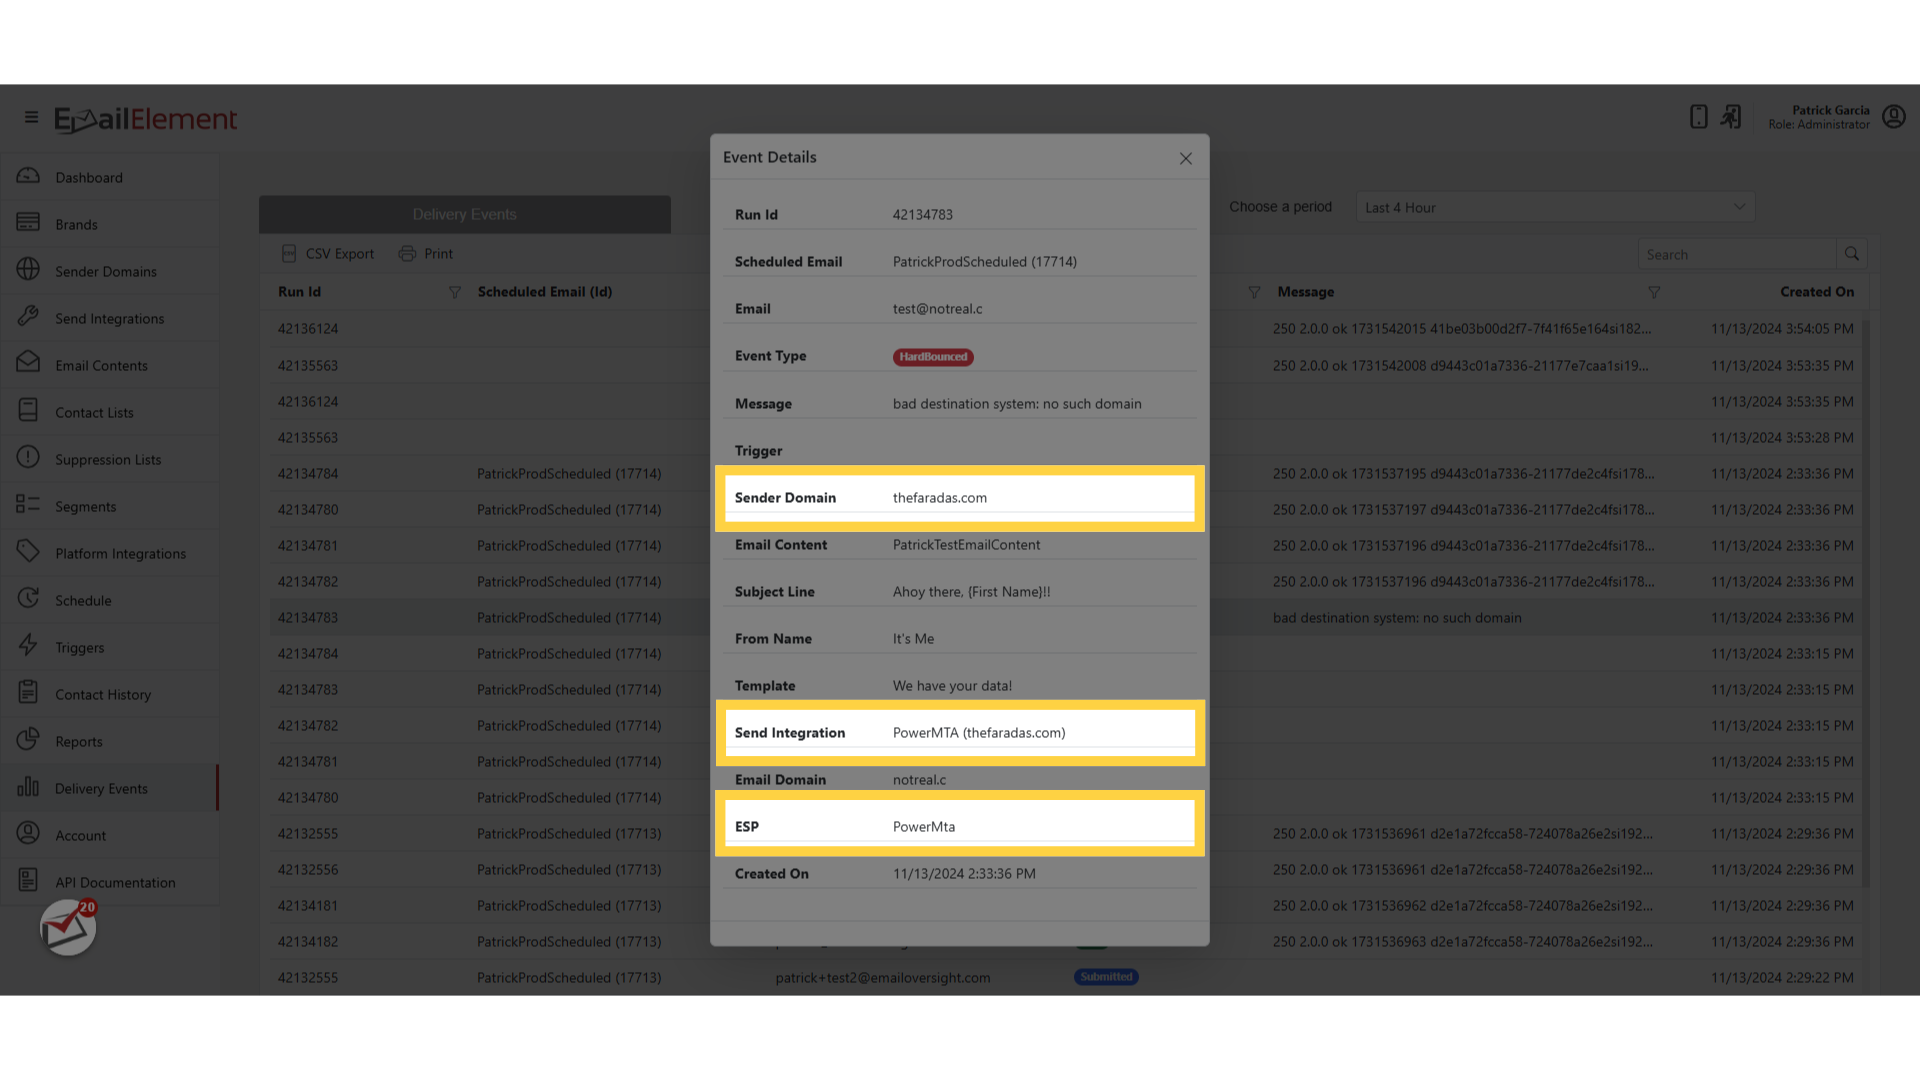
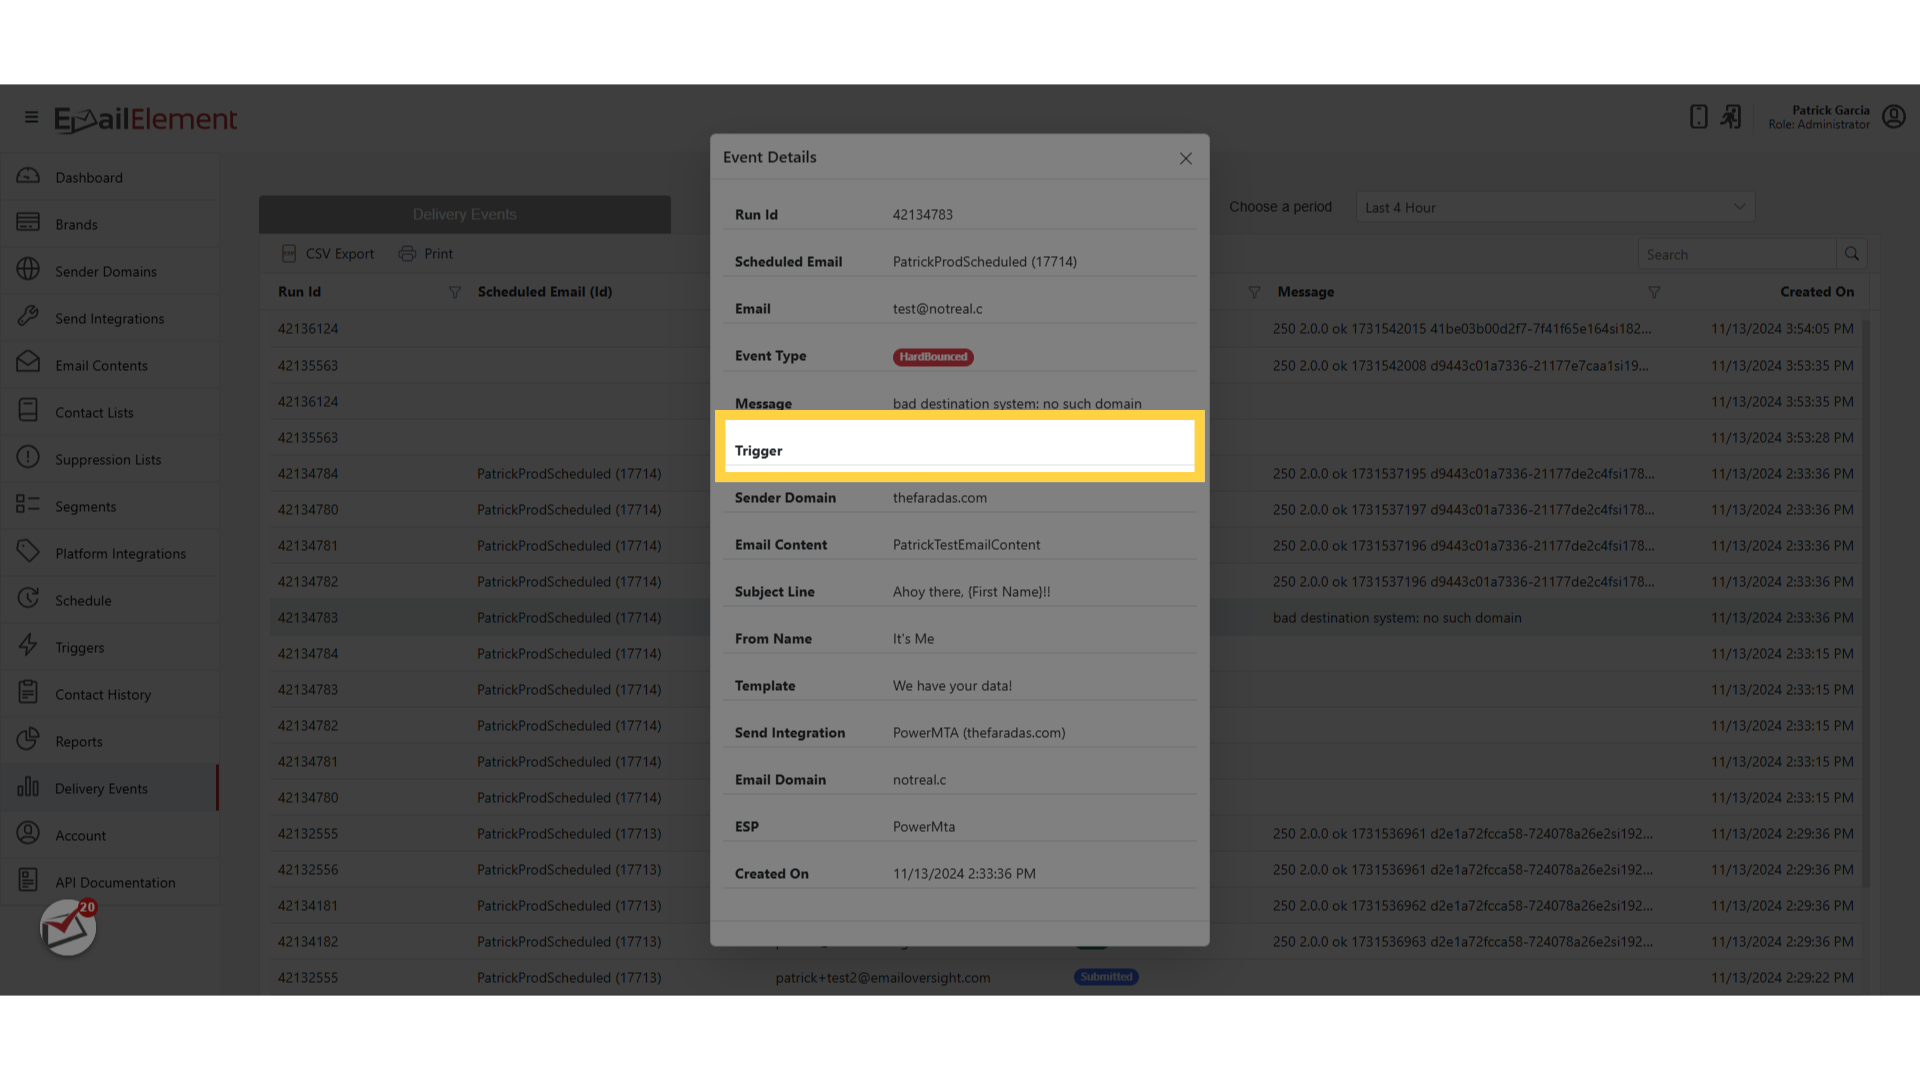
| Detail Field | Description |
|---|---|
| Trigger | Triggered Sequence name (if applicable) |
| Sender Domain | The sender domain used for this email |
| Email Content | The Email Content name used |
| Subject Line | The subject line used |
| From Name | The From Name used (or the Sender Domain's default From Name) |
| Template | The specific template within the Email Content |
| Email Domain | The specific recipient email domain |
| ESP | Which email service provider handled the delivery |
Step 5: Filter Events
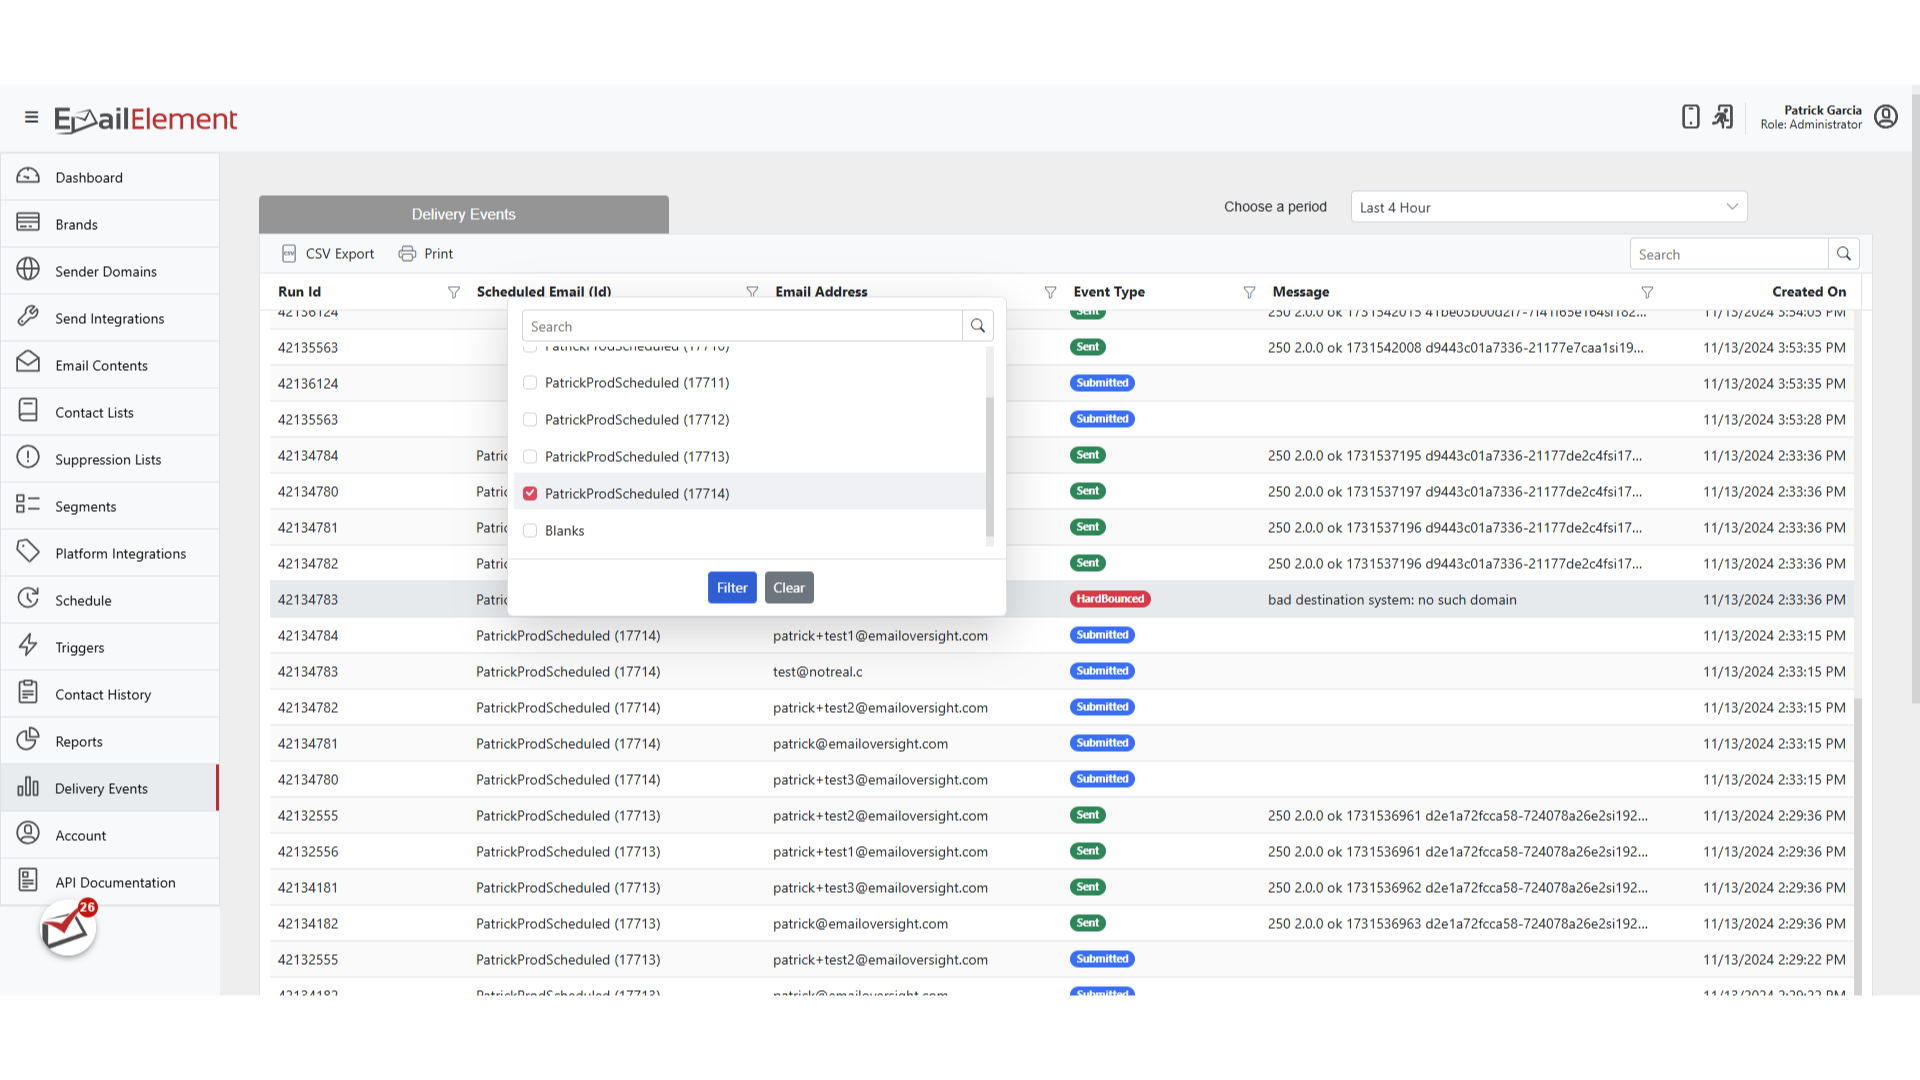
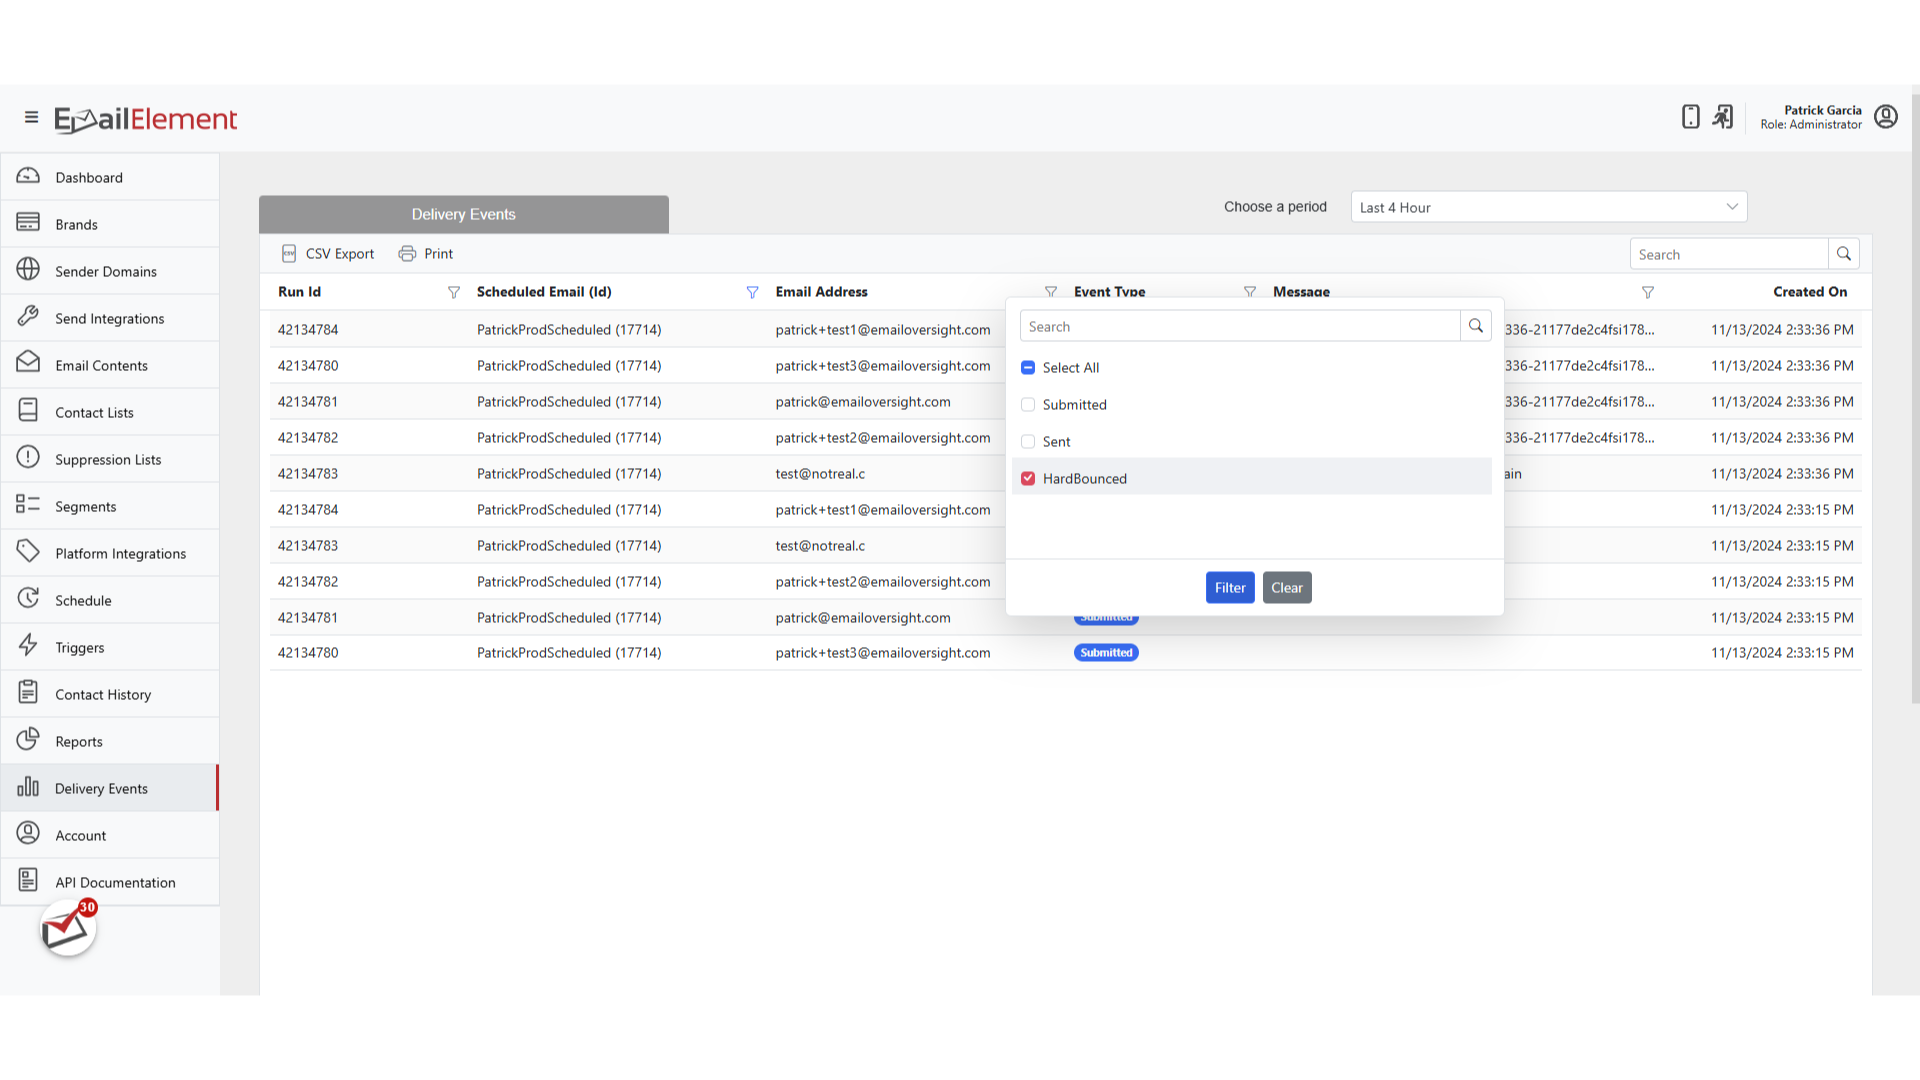
Click the filter icon on any column header to open checkbox filters
Filter by Source: check/uncheck specific Scheduled Emails, Triggered Sequences, or Transactional Relays
Filter by Event Type: check/uncheck specific event types (e.g., show only HardBounced and Failed)
Combine multiple column filters for precise results
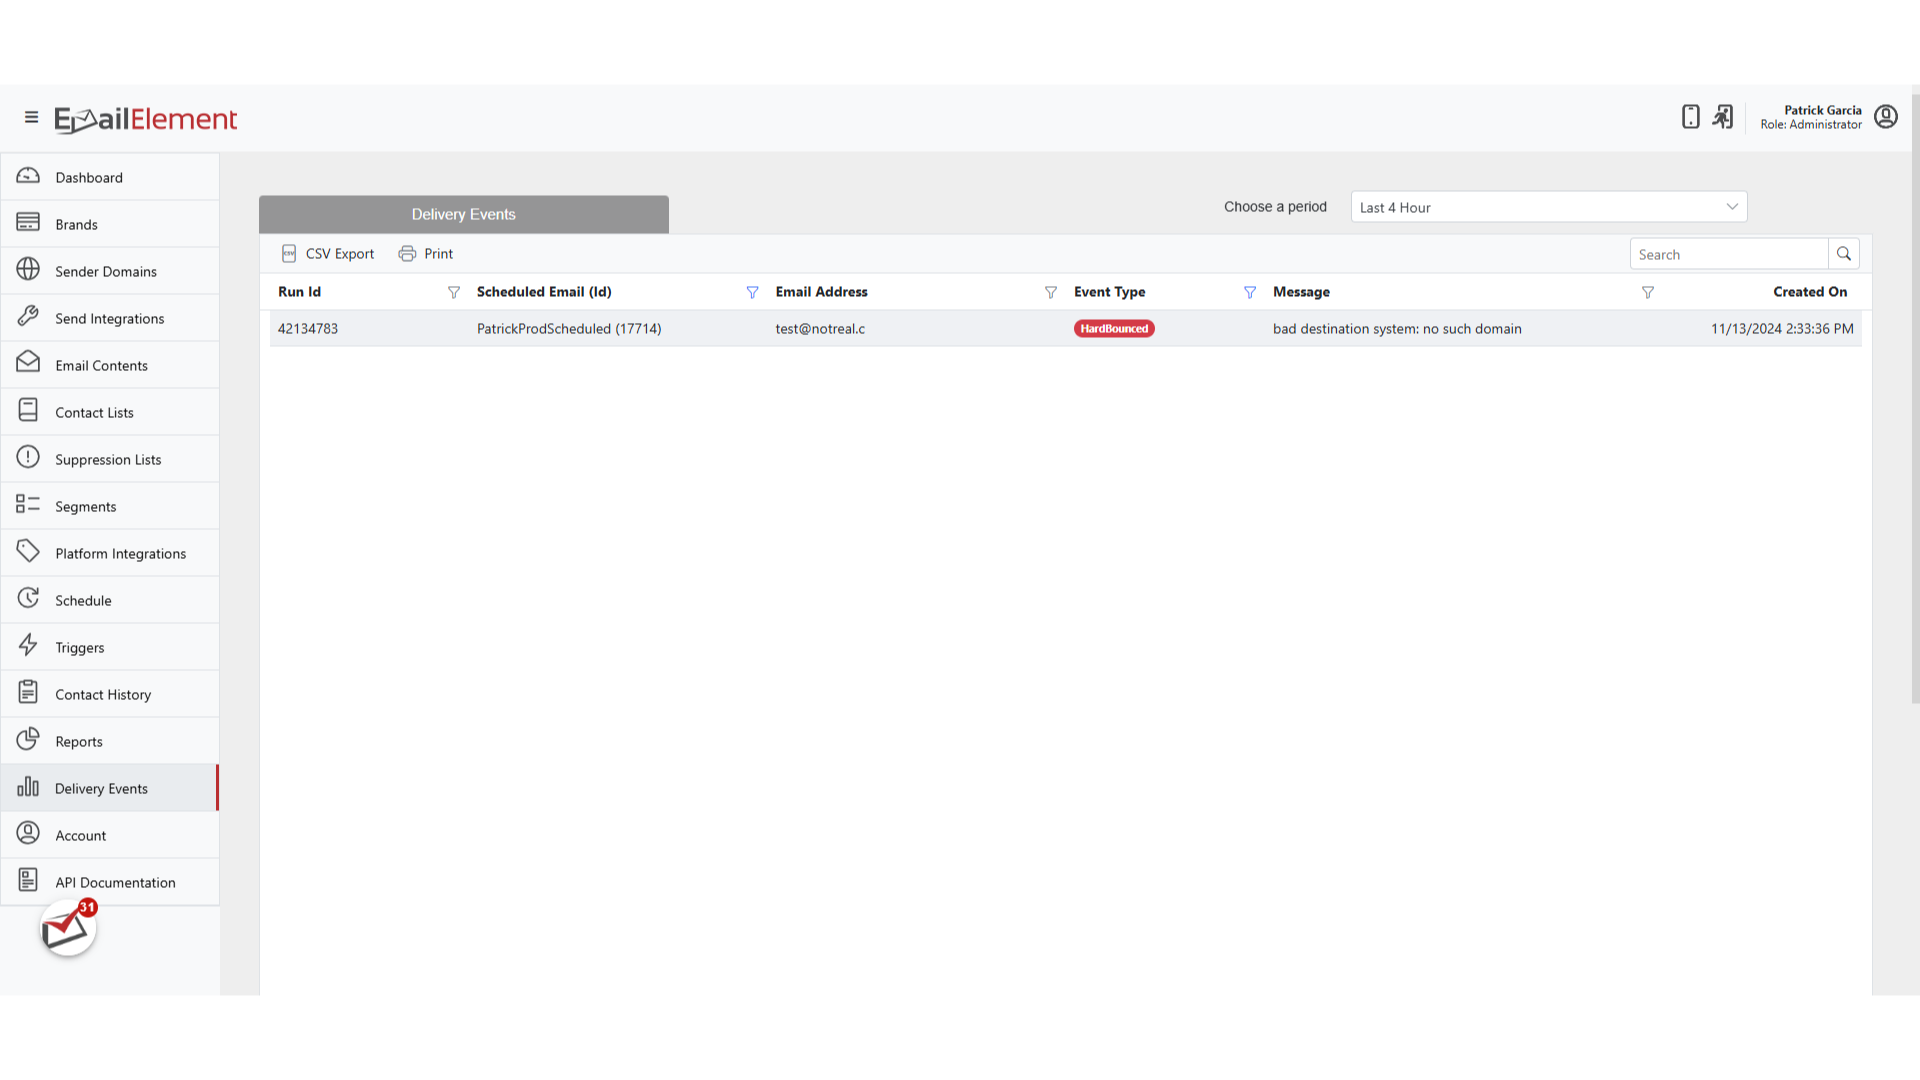
- Example: Source = "March Newsletter" AND Event Type = "HardBounced"
Filters can be pre-applied when navigating from the Dashboard (e.g., clicking a bounce count on a Scheduled Email card)
Step 6: Export Data
- Click CSV Export in the toolbar to start a background export
- Export status: Pending → InProgress → Success
- When status shows Success, click the download icon to download the CSV file
- To cancel an in-progress export, click the cancel icon (X)
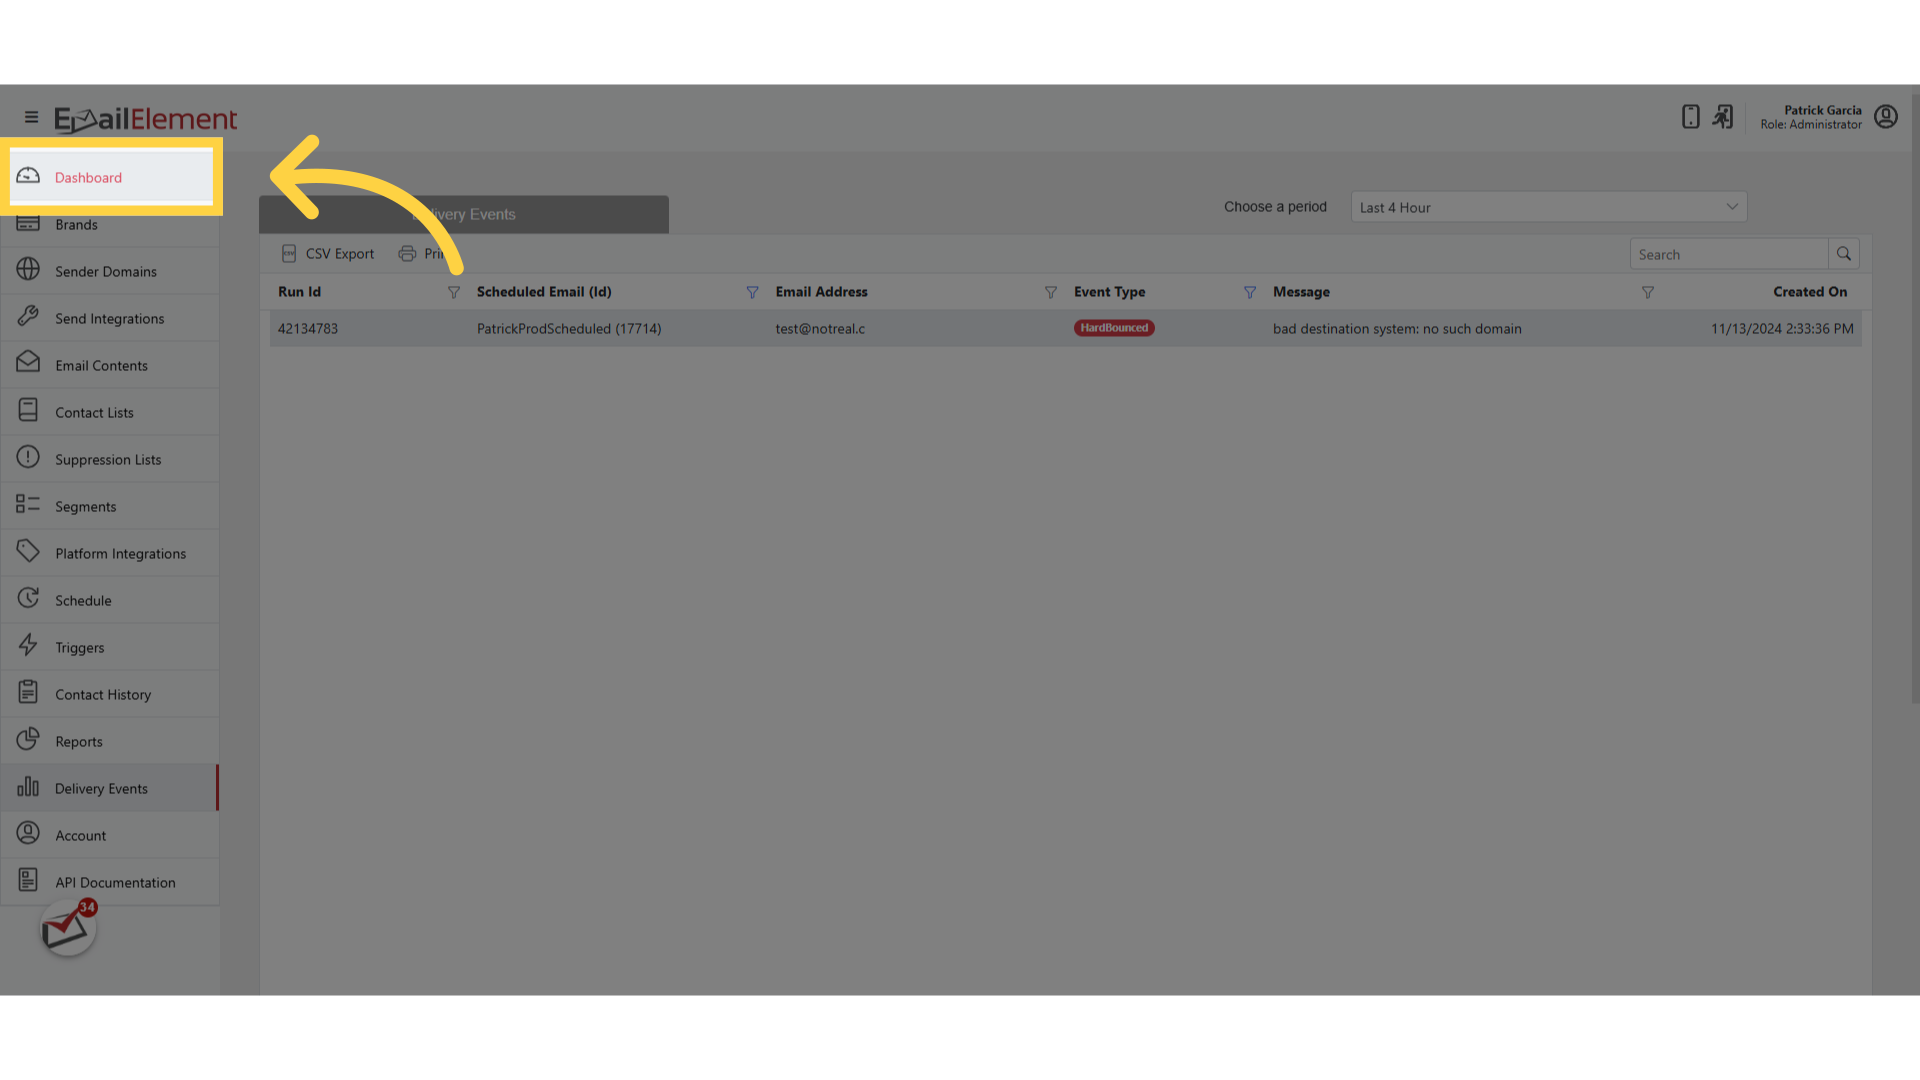
Step 7: Access from Dashboard
Navigate to the Dashboard
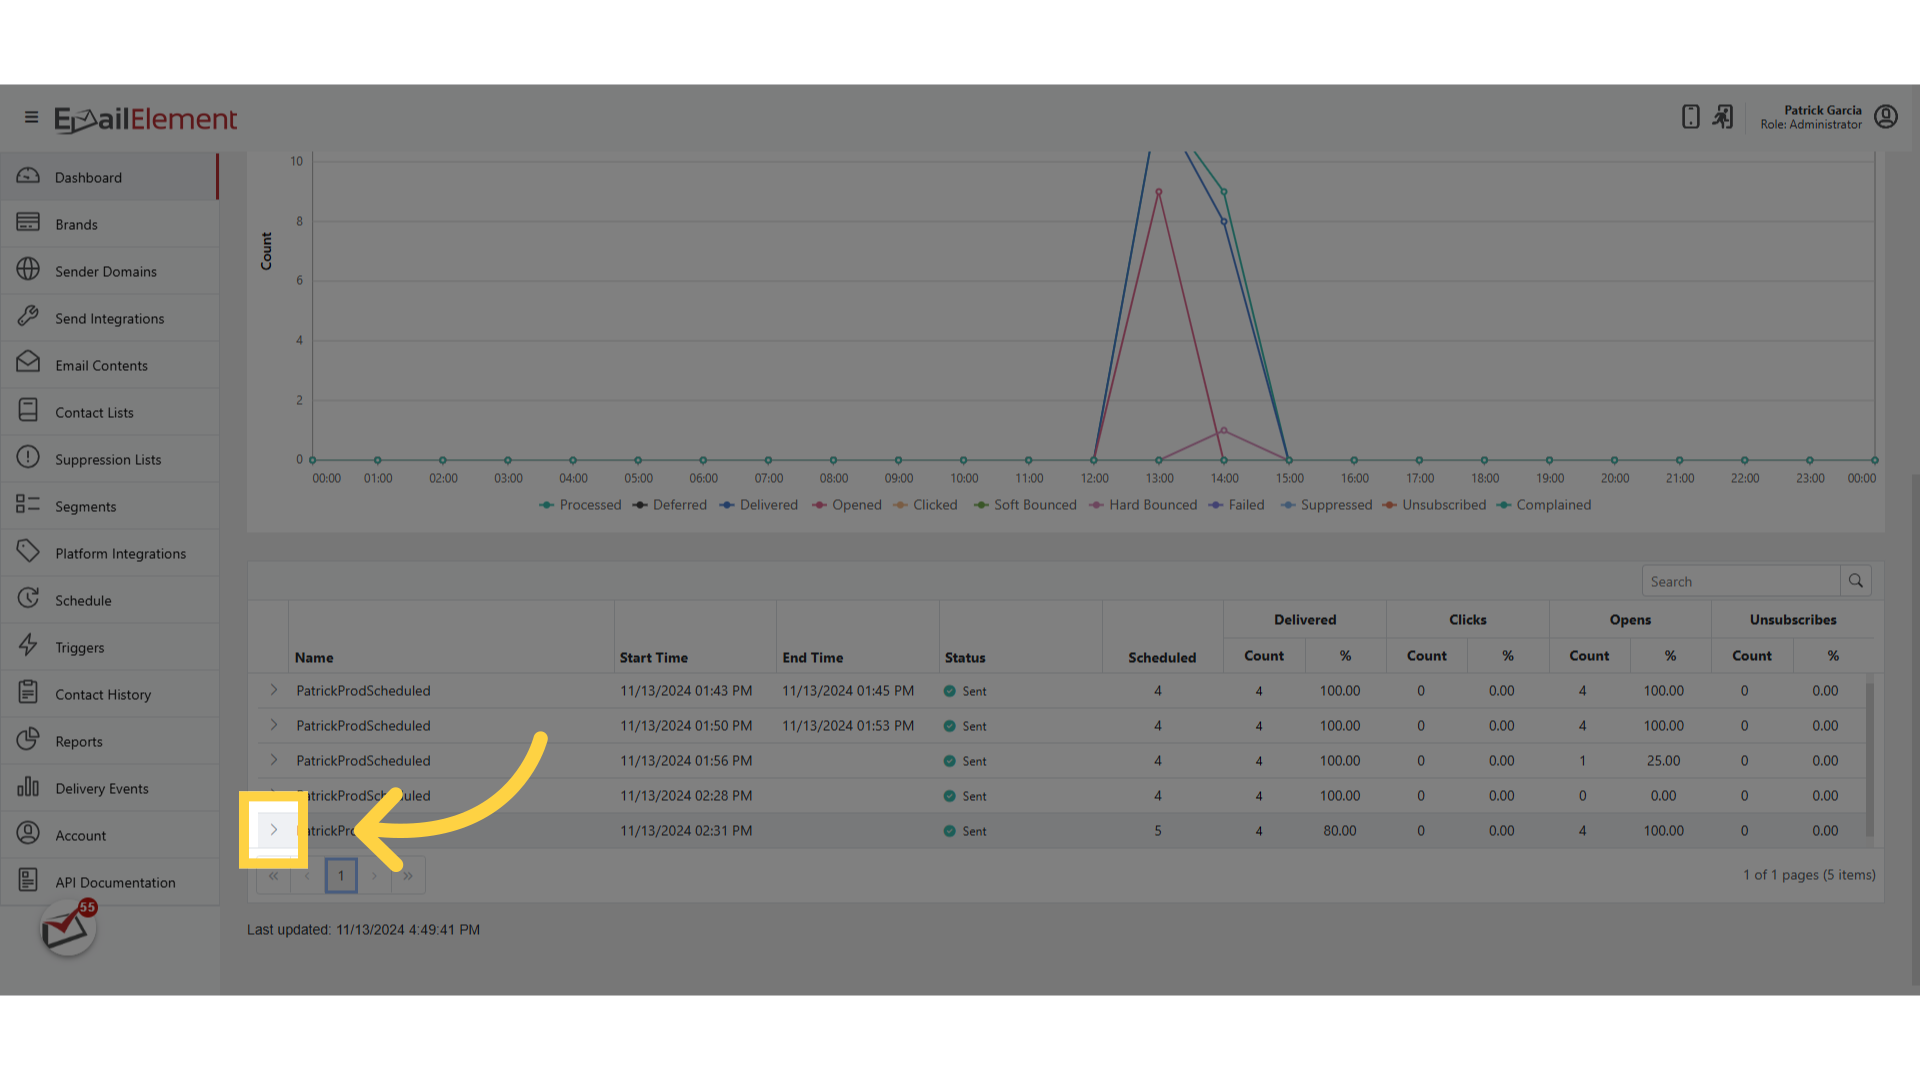
Expand a Scheduled Email card to see summary counts
Click the number next to any event type:
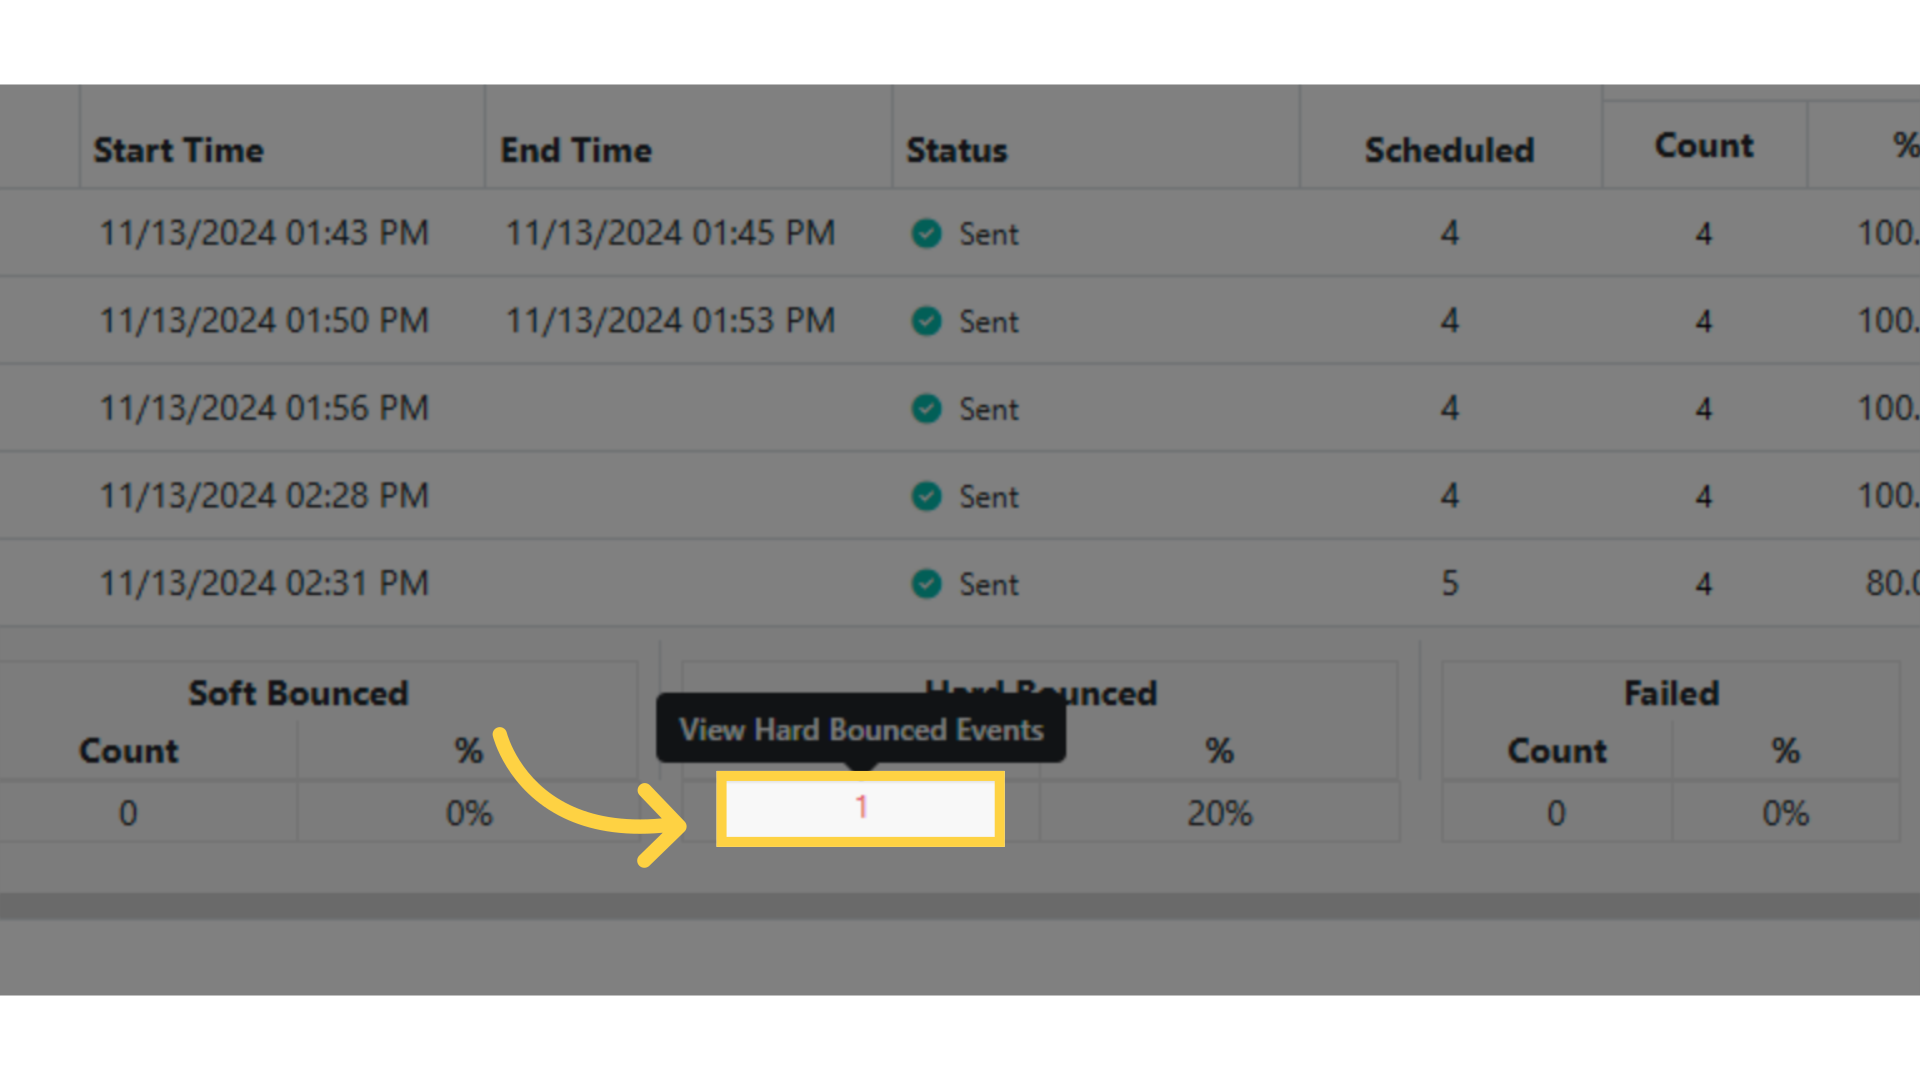
- Soft Bounced count — opens Delivery Events pre-filtered to soft bounces for that campaign
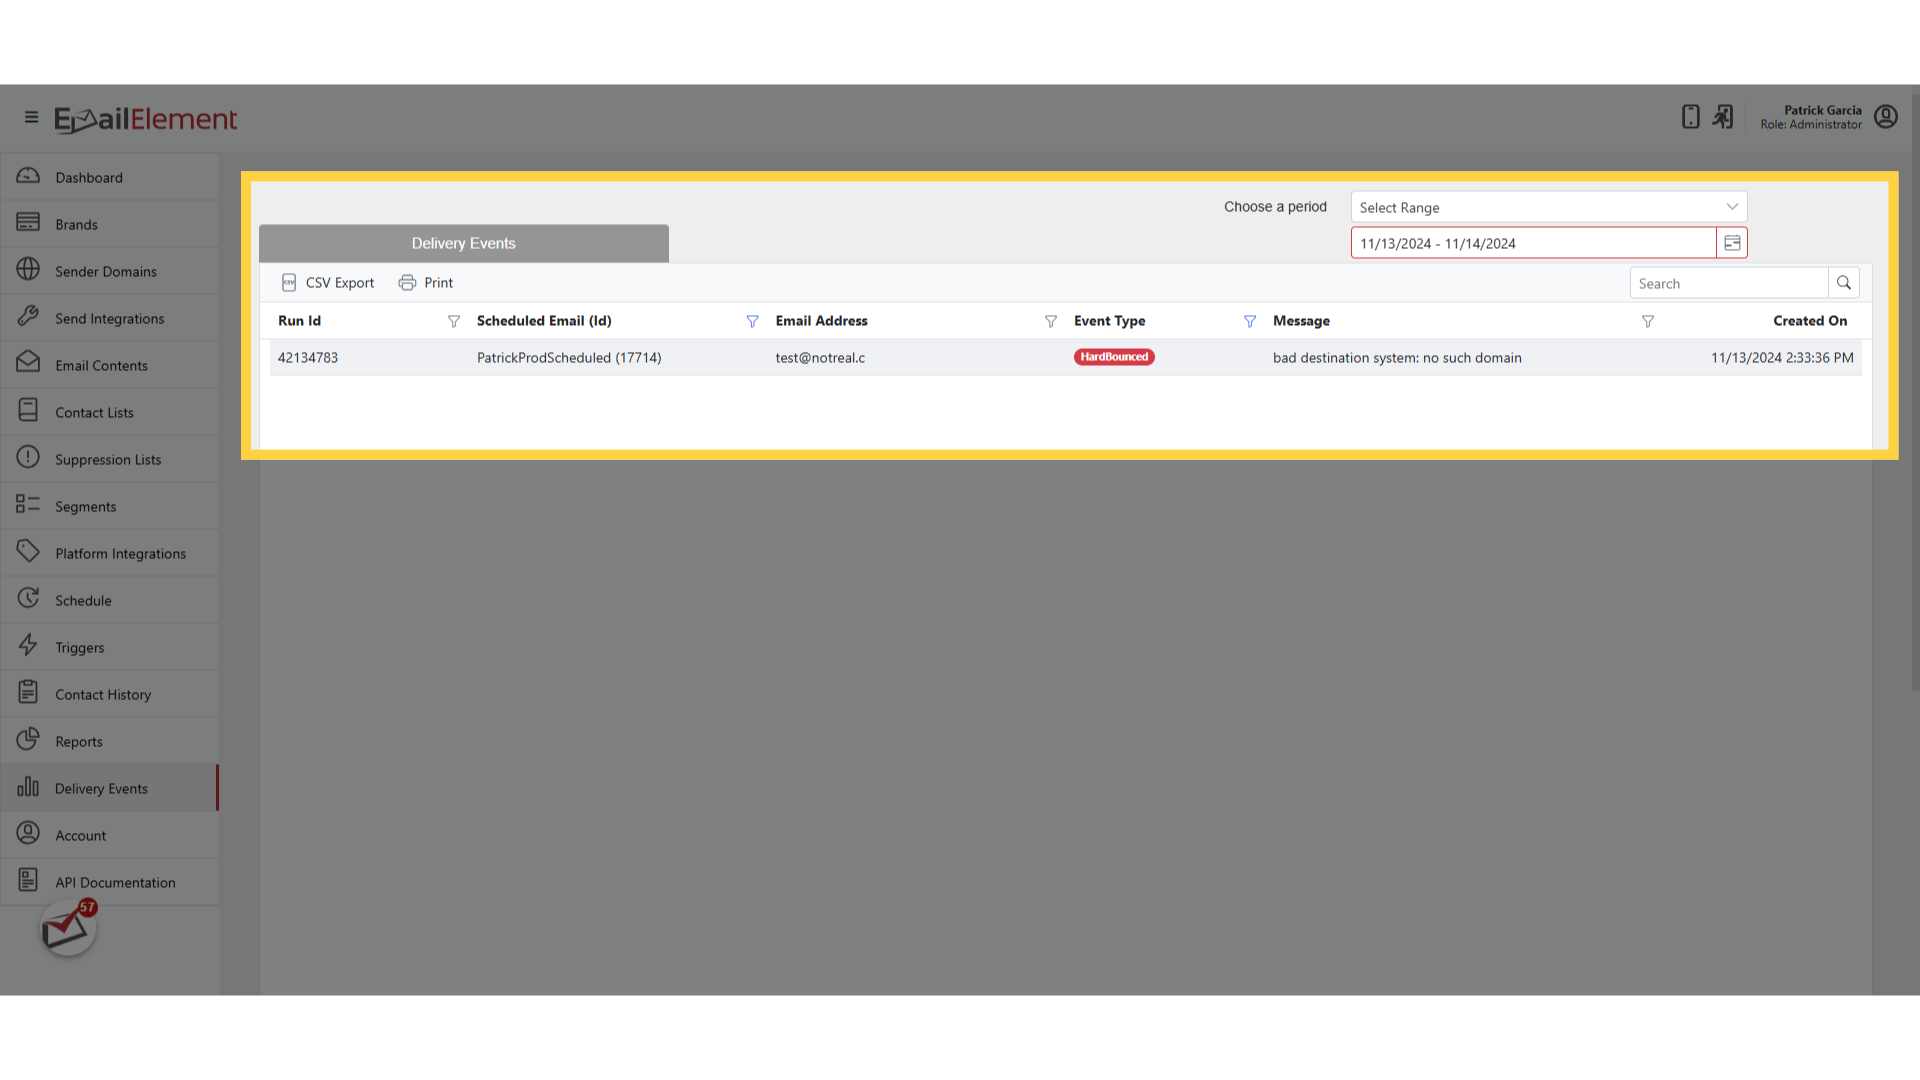
- Hard Bounced count — opens Delivery Events pre-filtered to hard bounces
- Failed count — opens Delivery Events pre-filtered to failures
This is the fastest way to investigate issues with a specific send
Common Workflows
Investigating a Failed Campaign
- Go to Delivery Events
- Filter Source to the campaign name
- Filter Event Type to Failed
- Review the Message column for error details
- Click individual events to see ESP, Send Integration, and Sender Domain details
Monitoring Bounce Rates
- Set the period to match your campaign's send window
- Filter Event Type to HardBounced and SoftBounced
- Review the volume and recipient addresses
- Hard bounces should be suppressed; soft bounces may resolve on retry
Checking ESP Errors
- Filter Event Type to Error
- Review the Message column for ESP-specific error details
- Click events to see which ESP reported the error
- Check the ESP's dashboard or status page for more context