
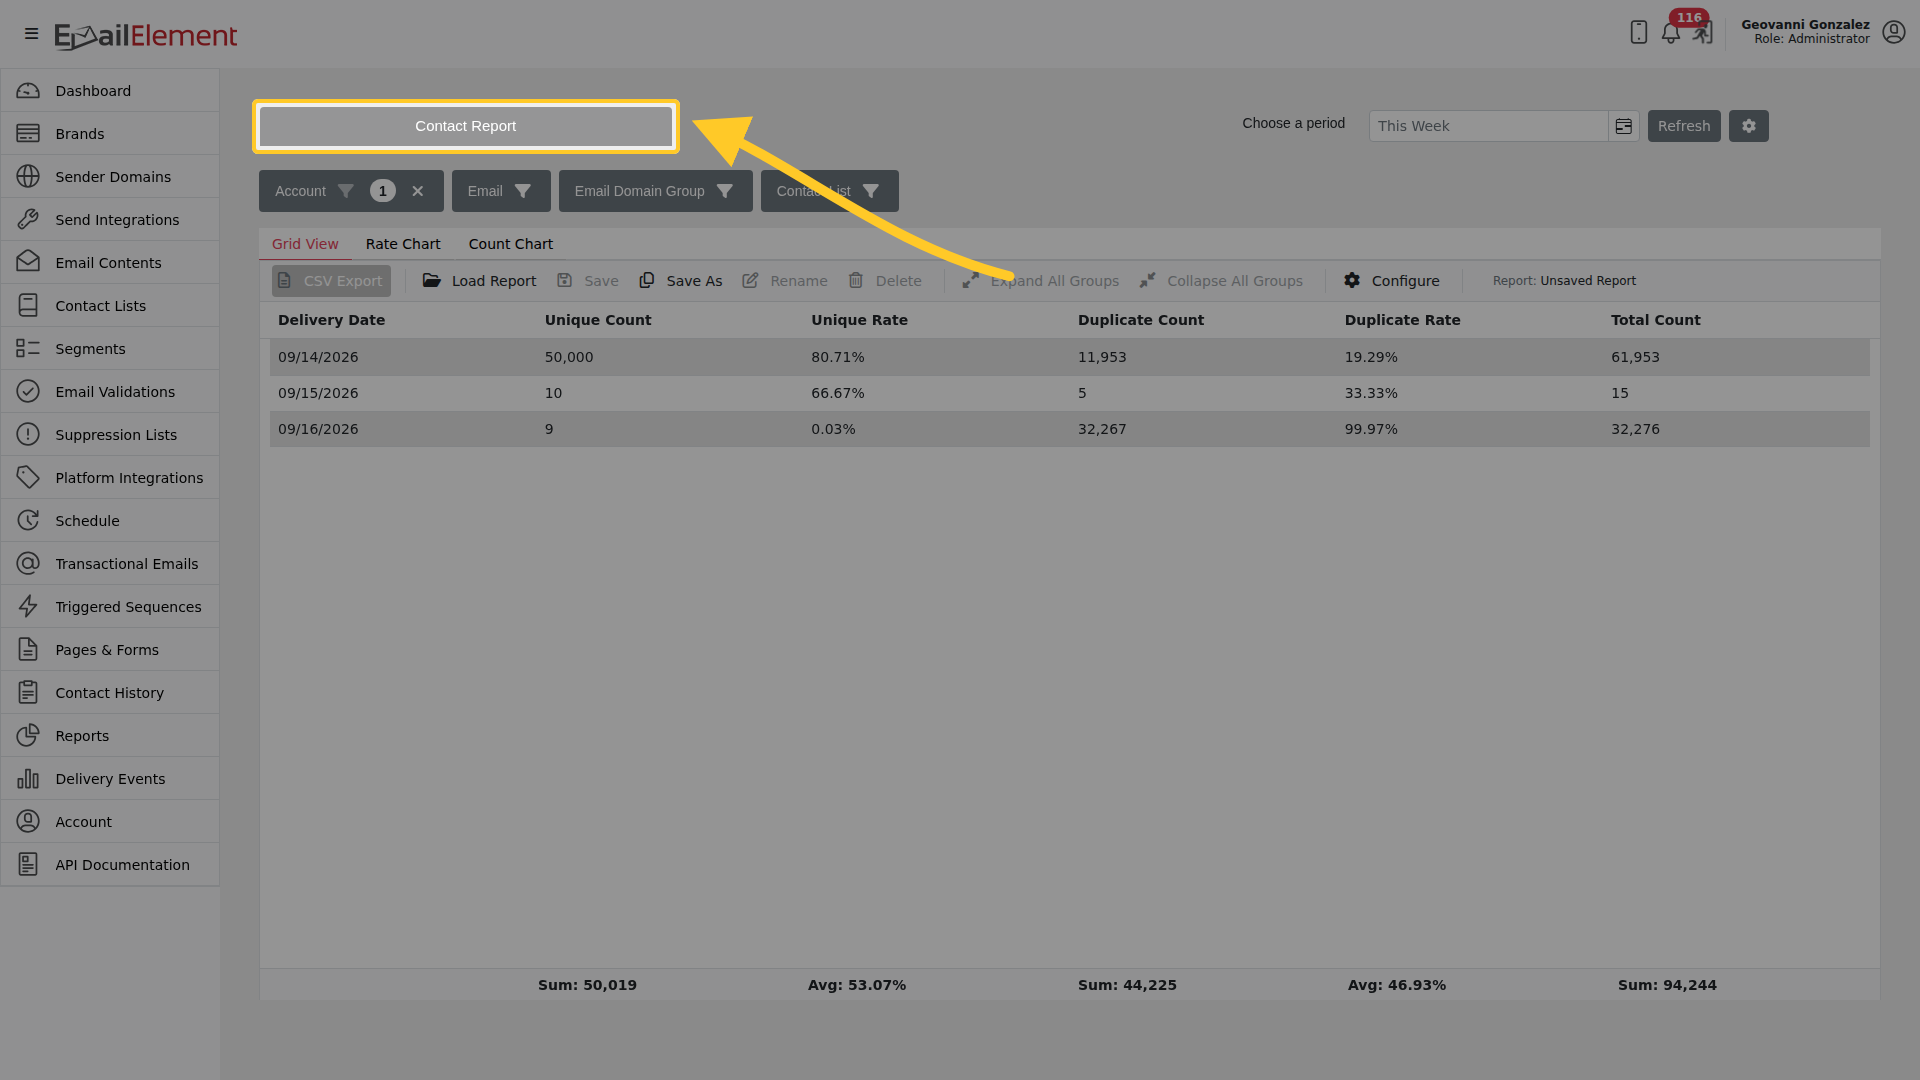
Contact Report
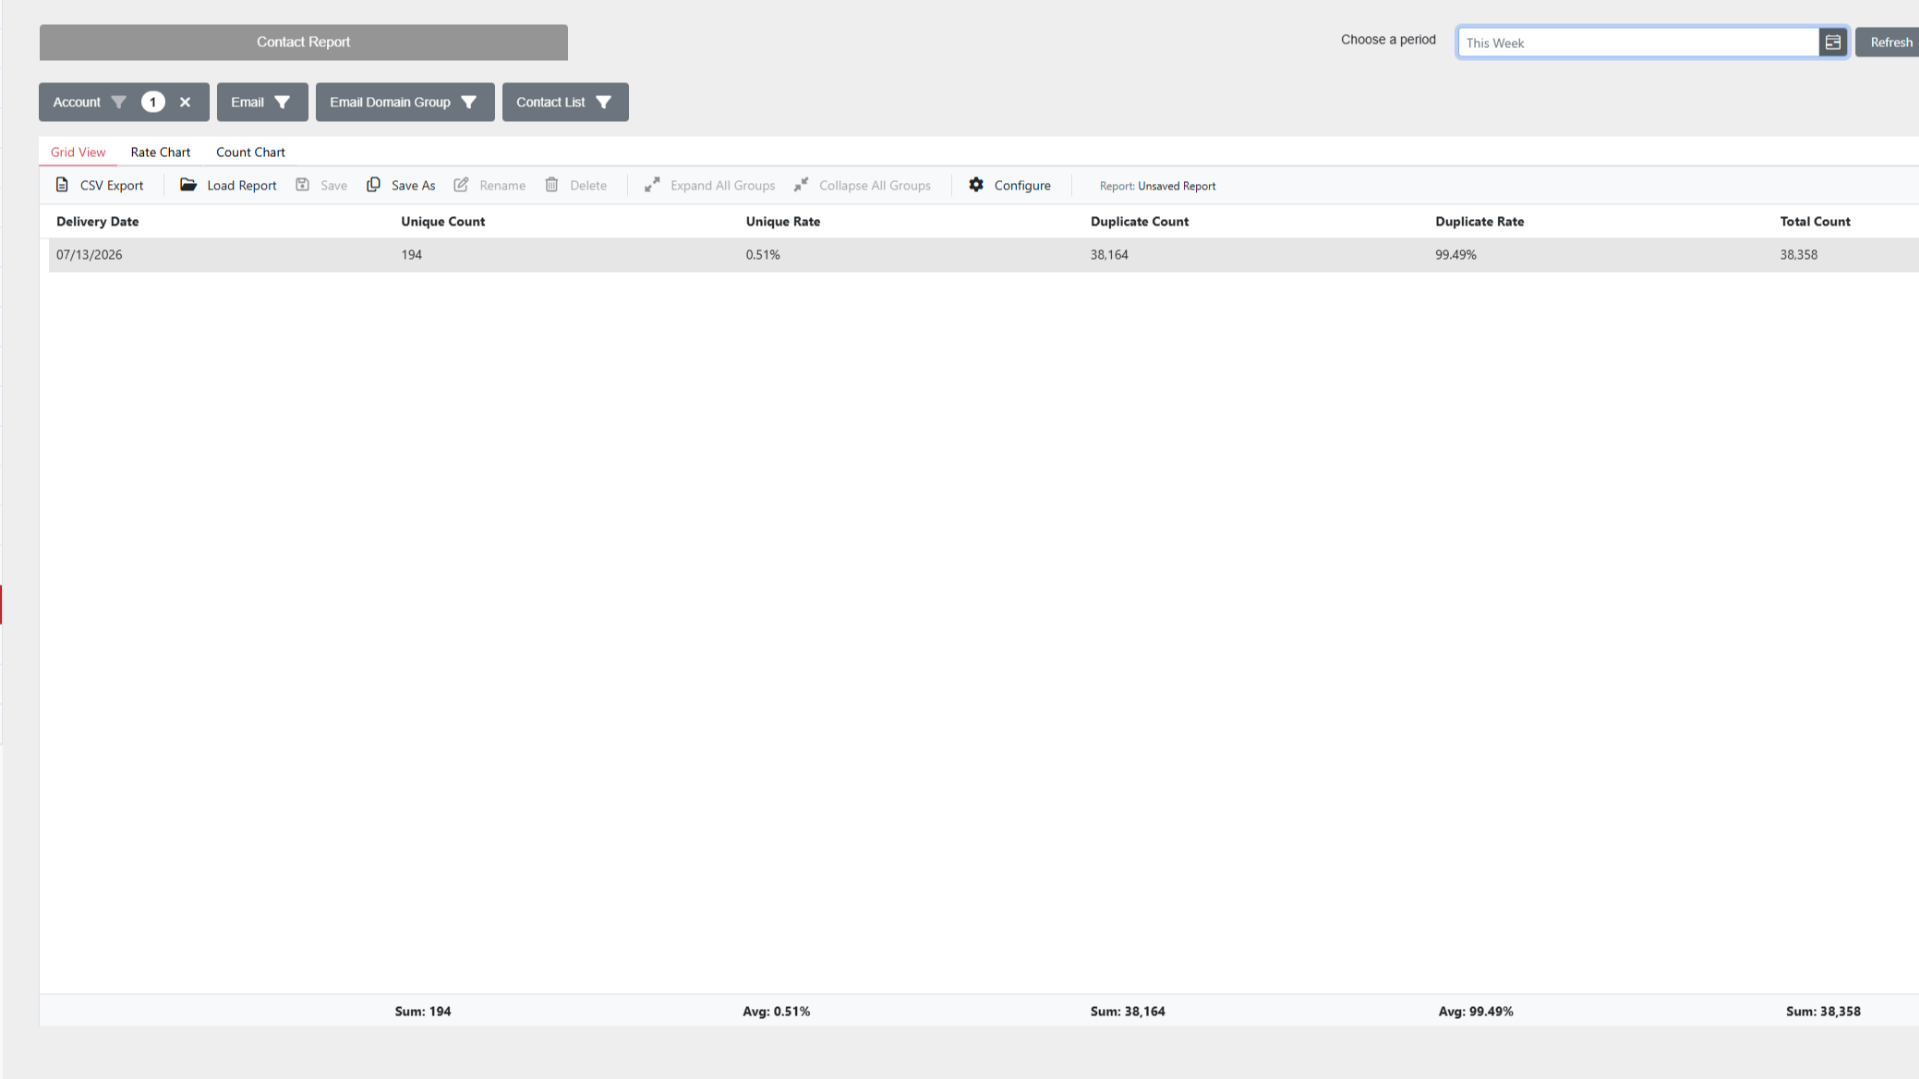
Shows where your contacts came from, and how many of them you already had. Every row splits into a Unique count and a Duplicate count, so you can see how much a source actually added.
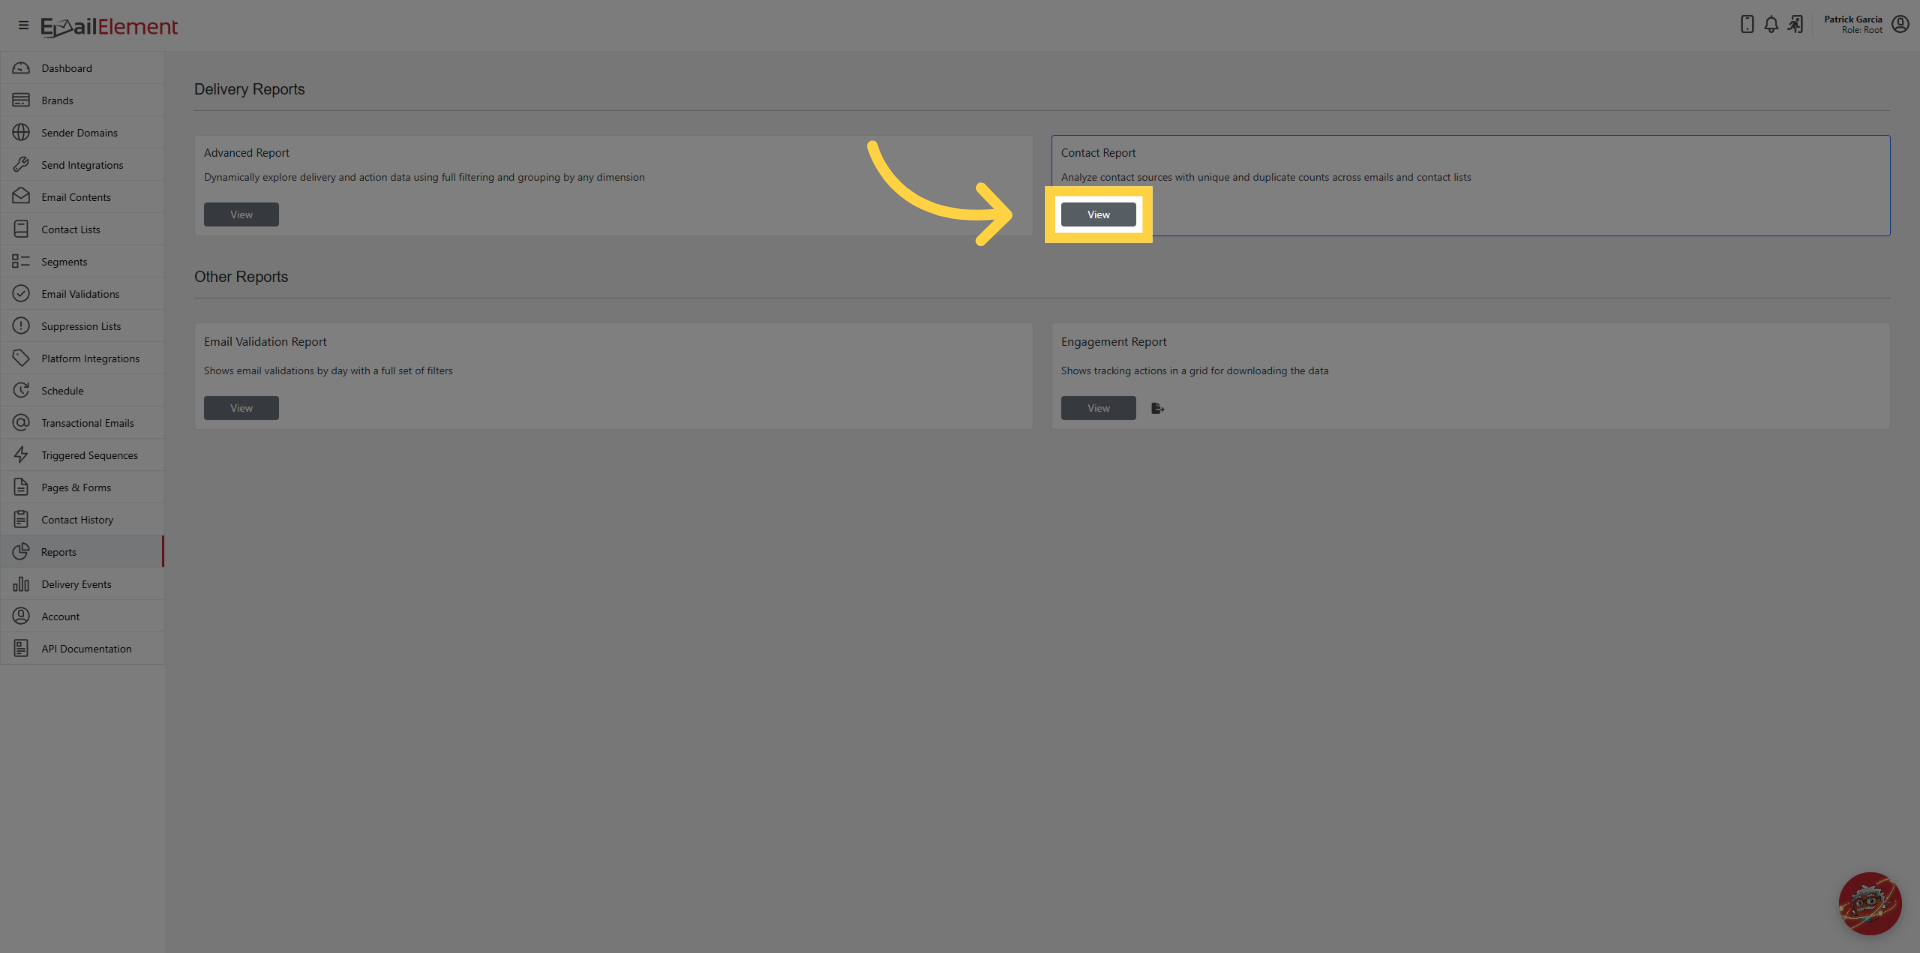
Reports > Contact Report > View, or go to /contactreportgrid.
Choosing a period
The date picker has Today, This Week, Last 30 Days, Last 60 Days and
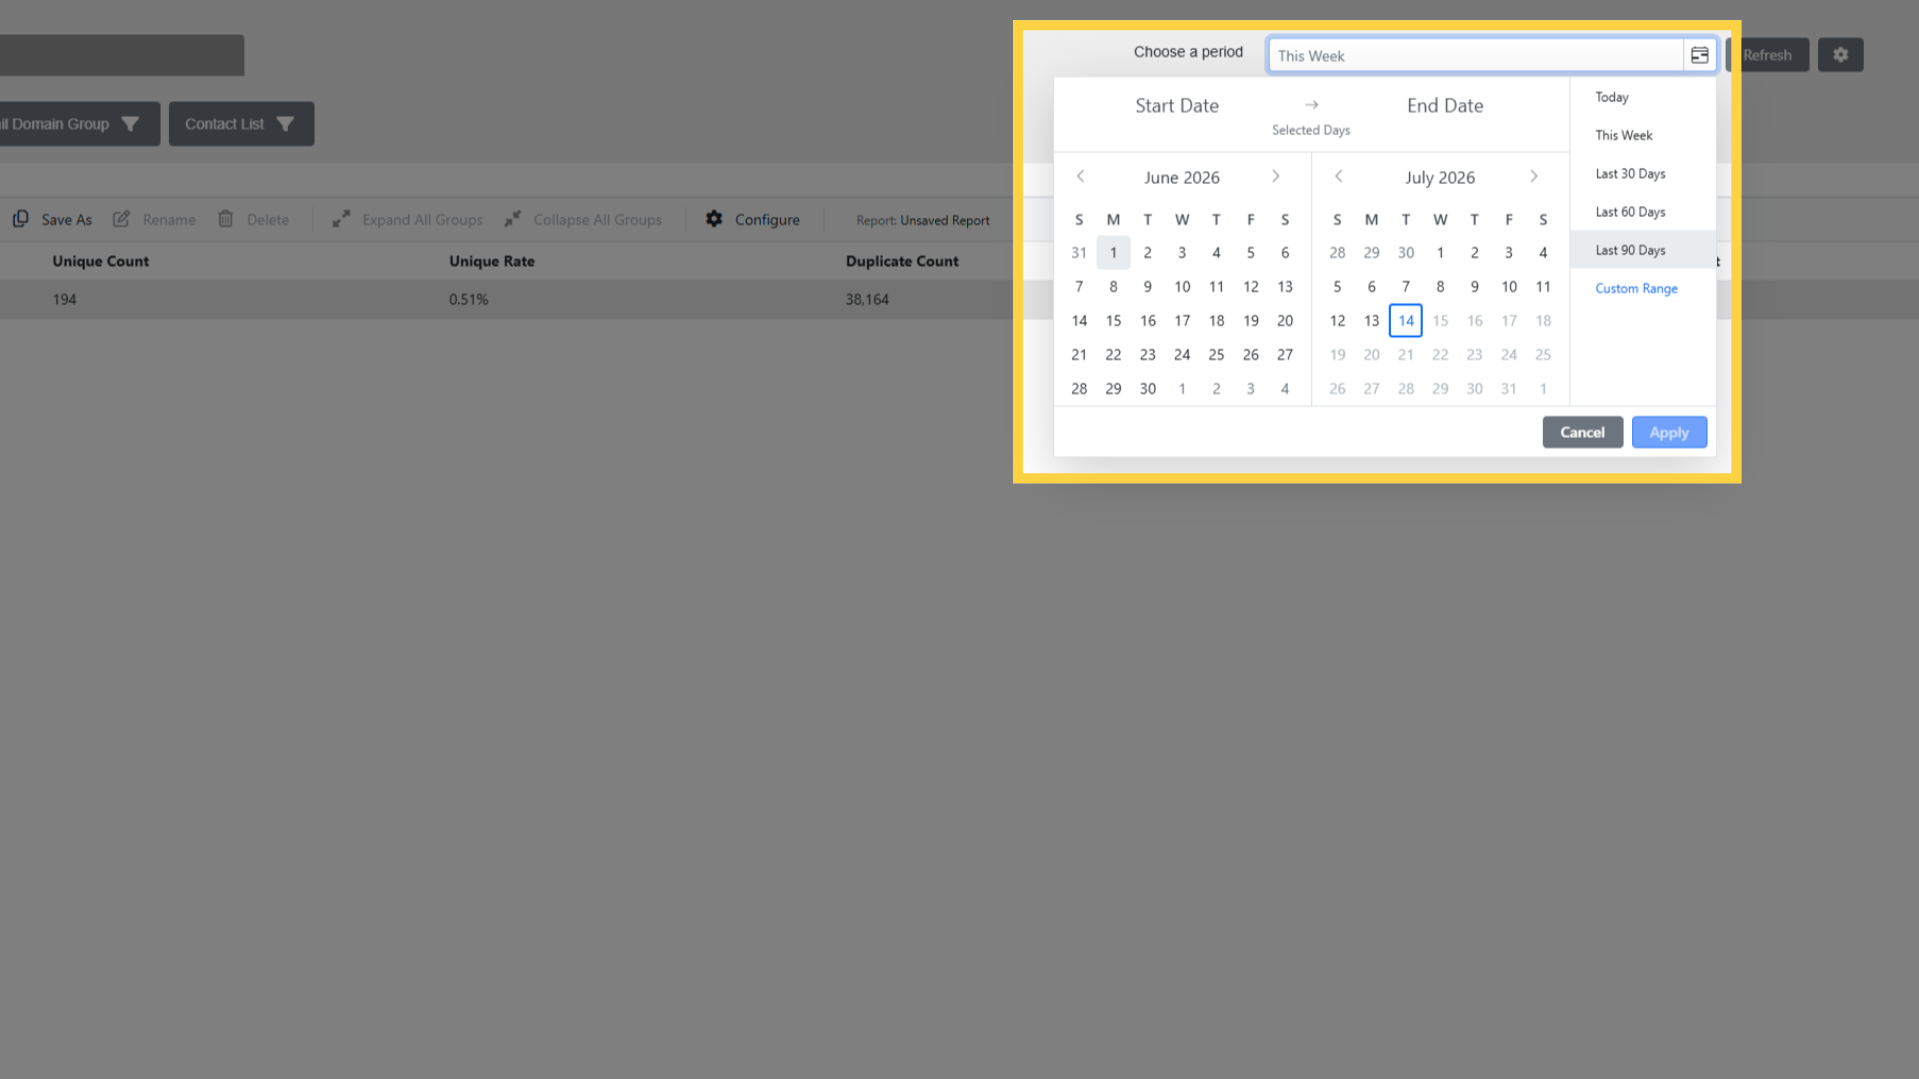 Last 90 Days, or pick your own dates. The earliest date you can choose is six months back.
Dates are in your account time zone.
Last 90 Days, or pick your own dates. The earliest date you can choose is six months back.
Dates are in your account time zone.
Group by
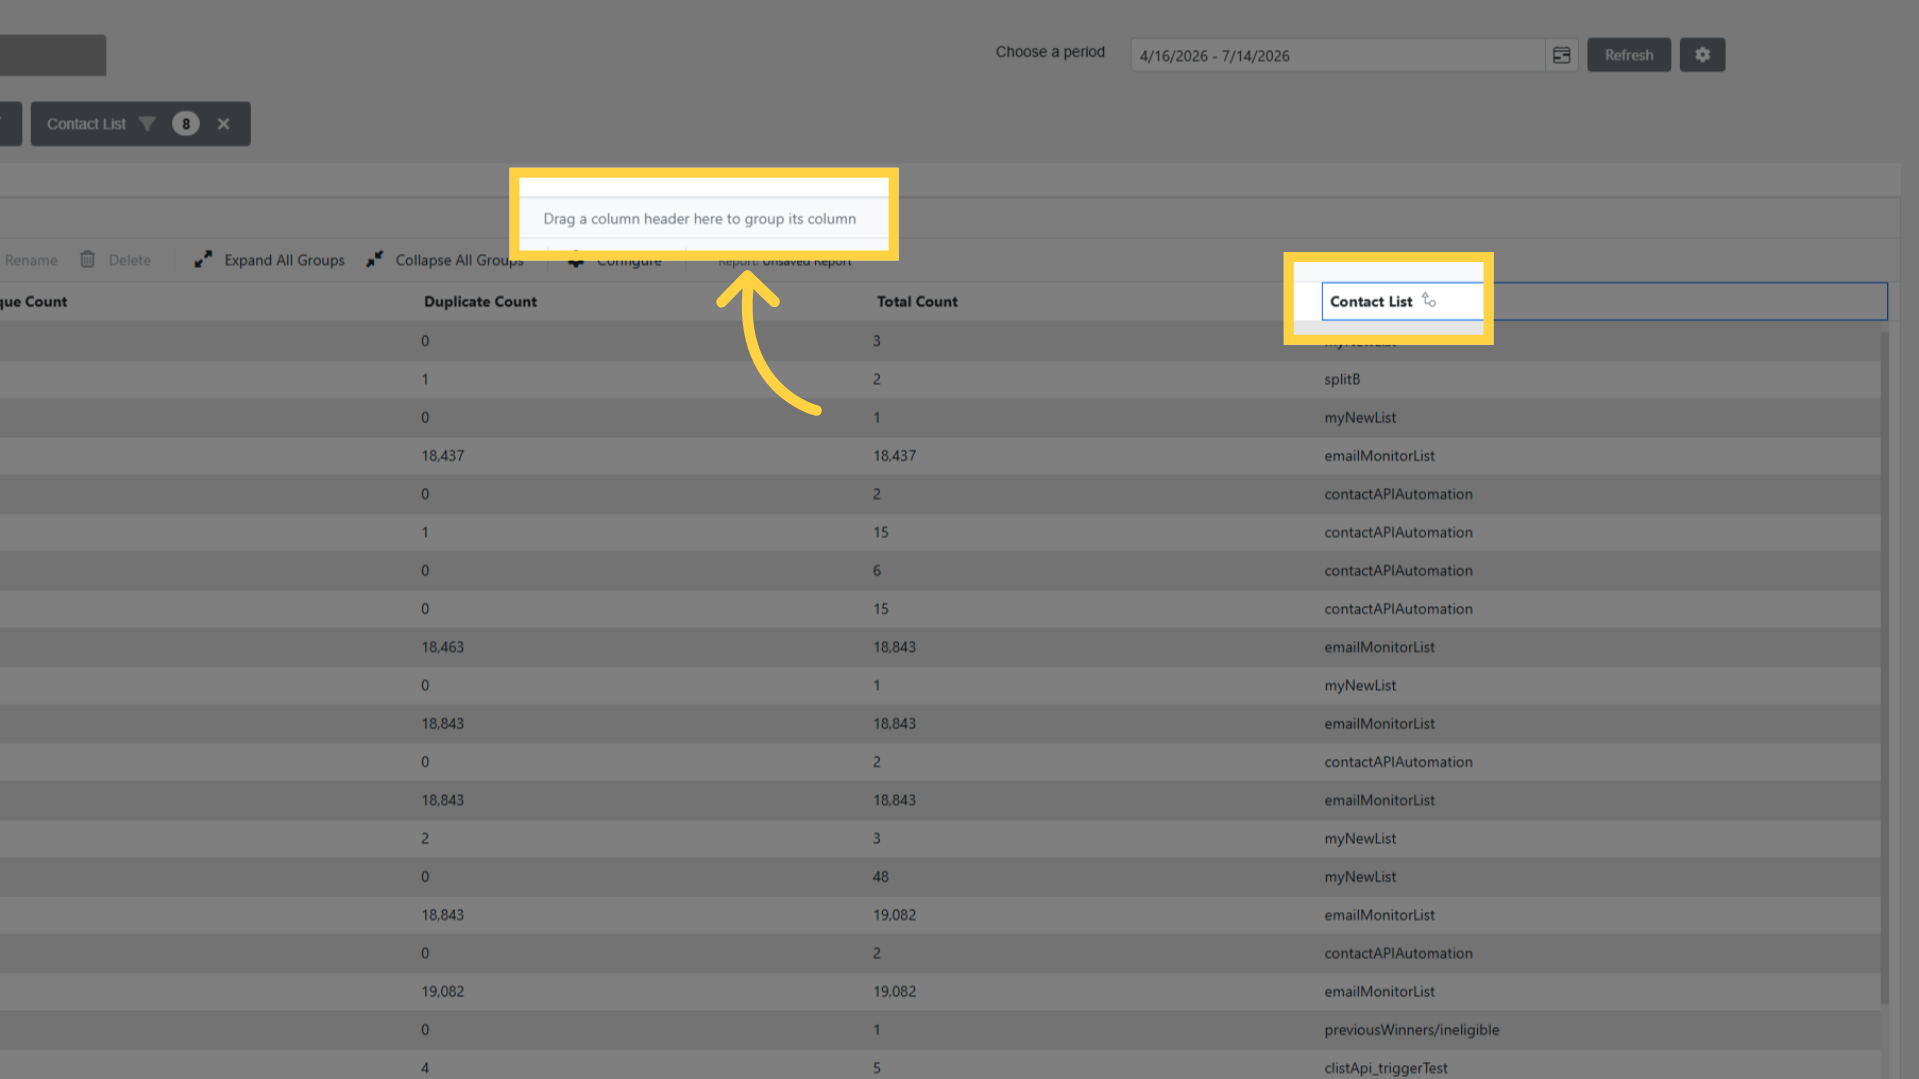
| Dimension |
|---|
| Delivery Date |
| Delivery Week |
| Delivery Month |
| Email Domain Group |
| Contact Lists |
Filter by
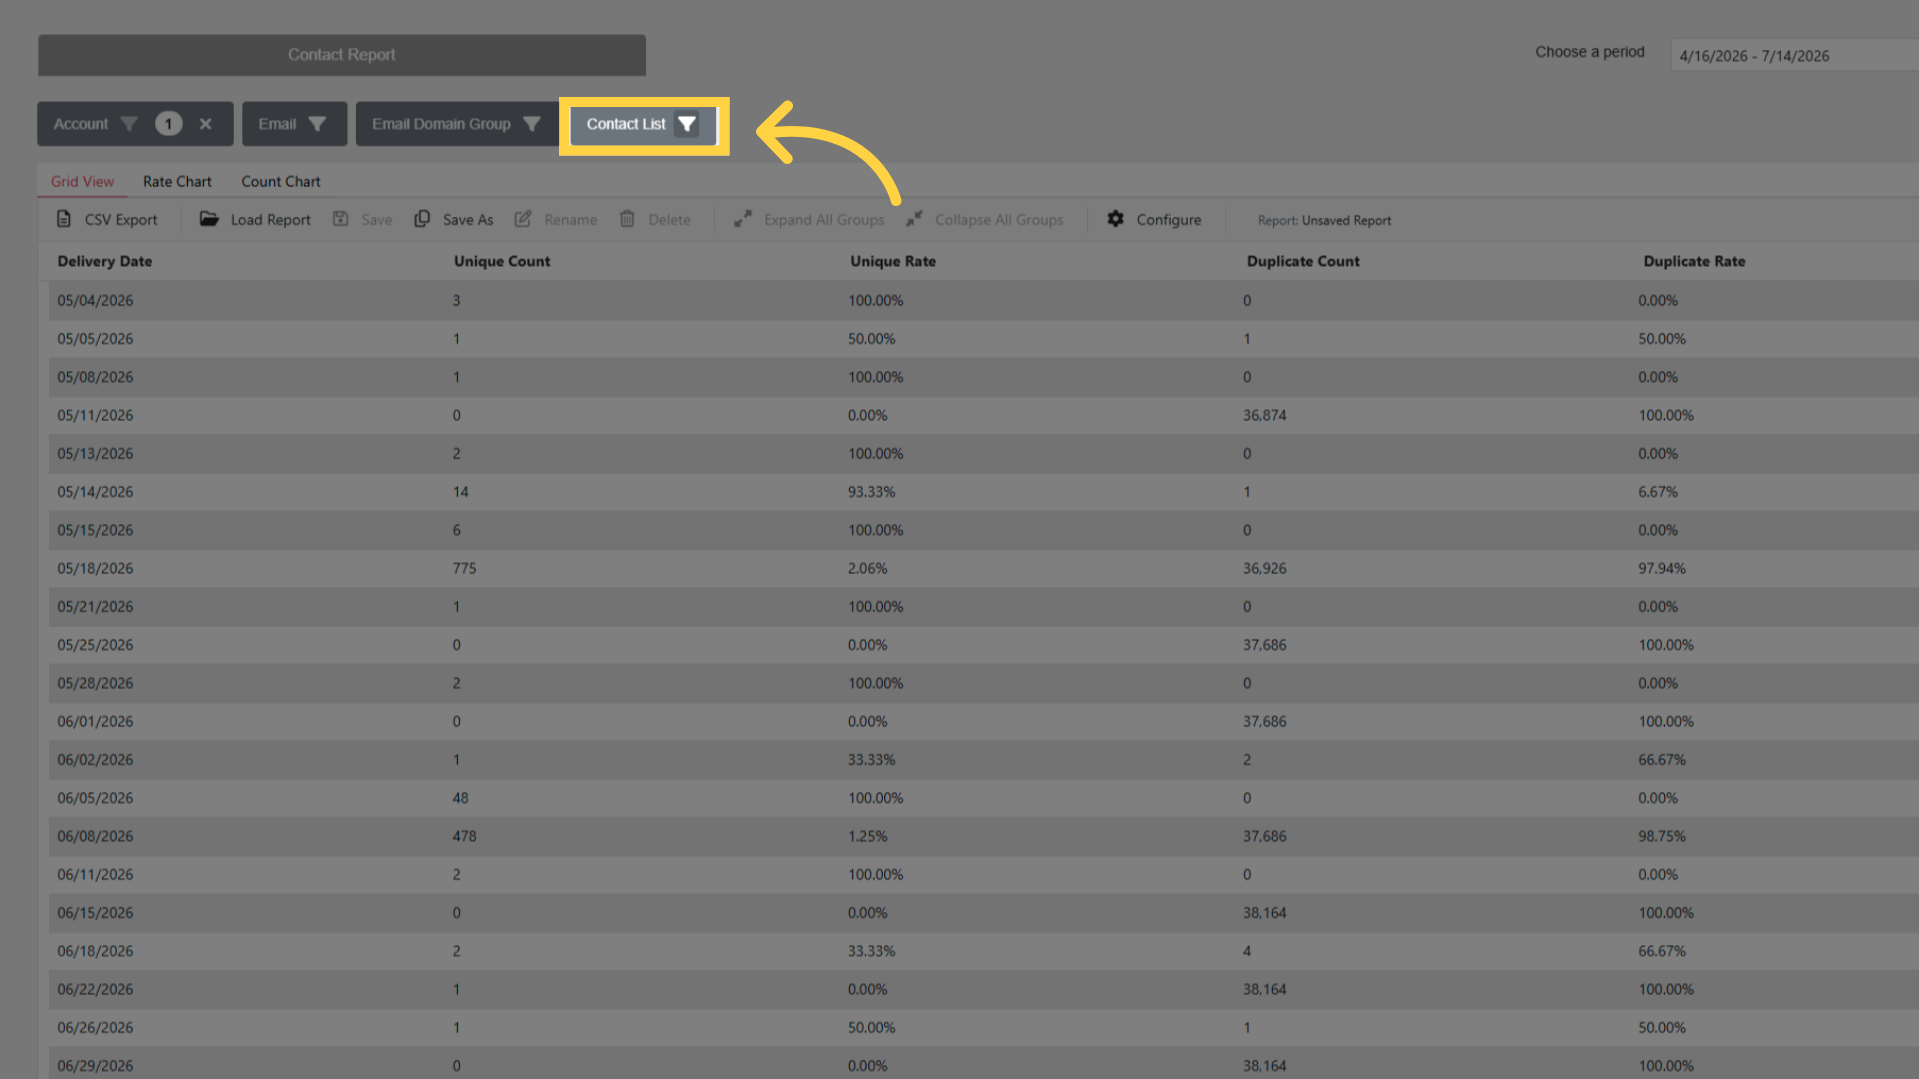
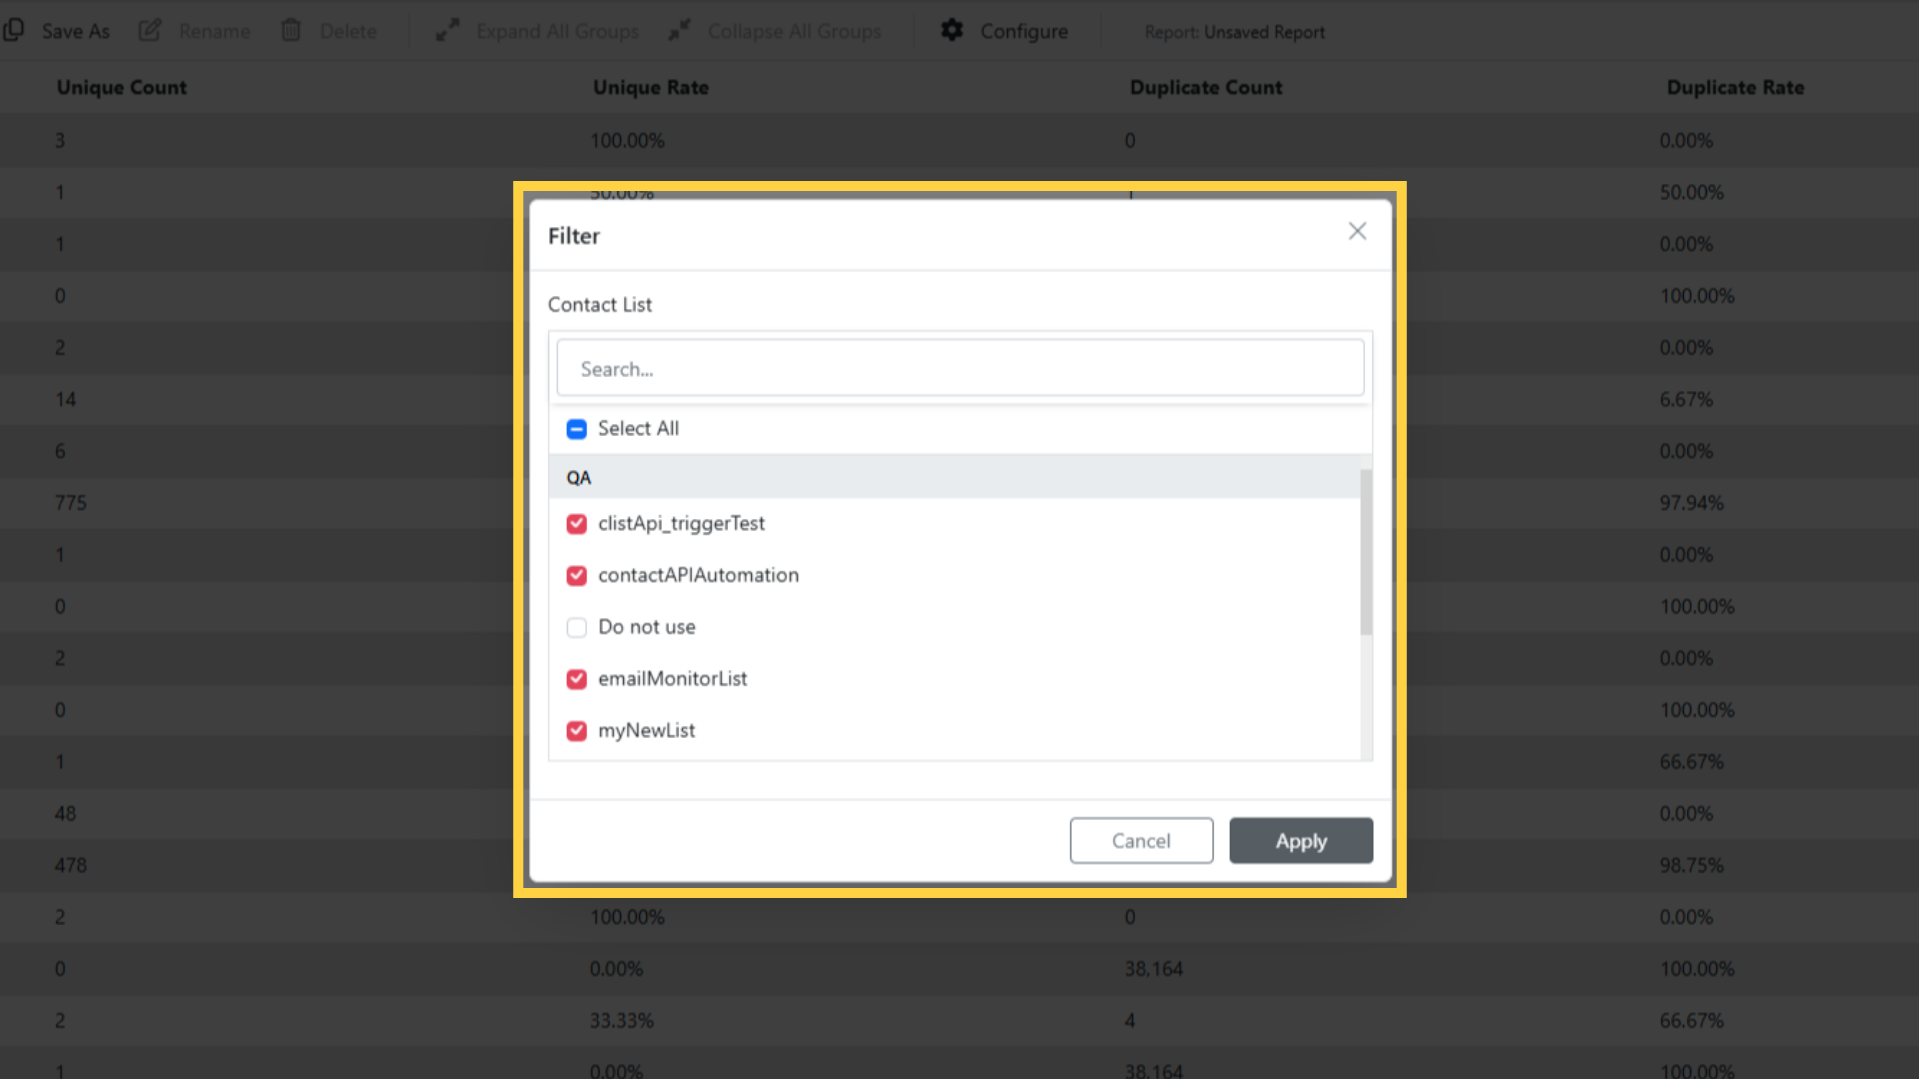
| Filter |
|---|
| Emails |
| Email Domain Group |
| Contact Lists |
Columns
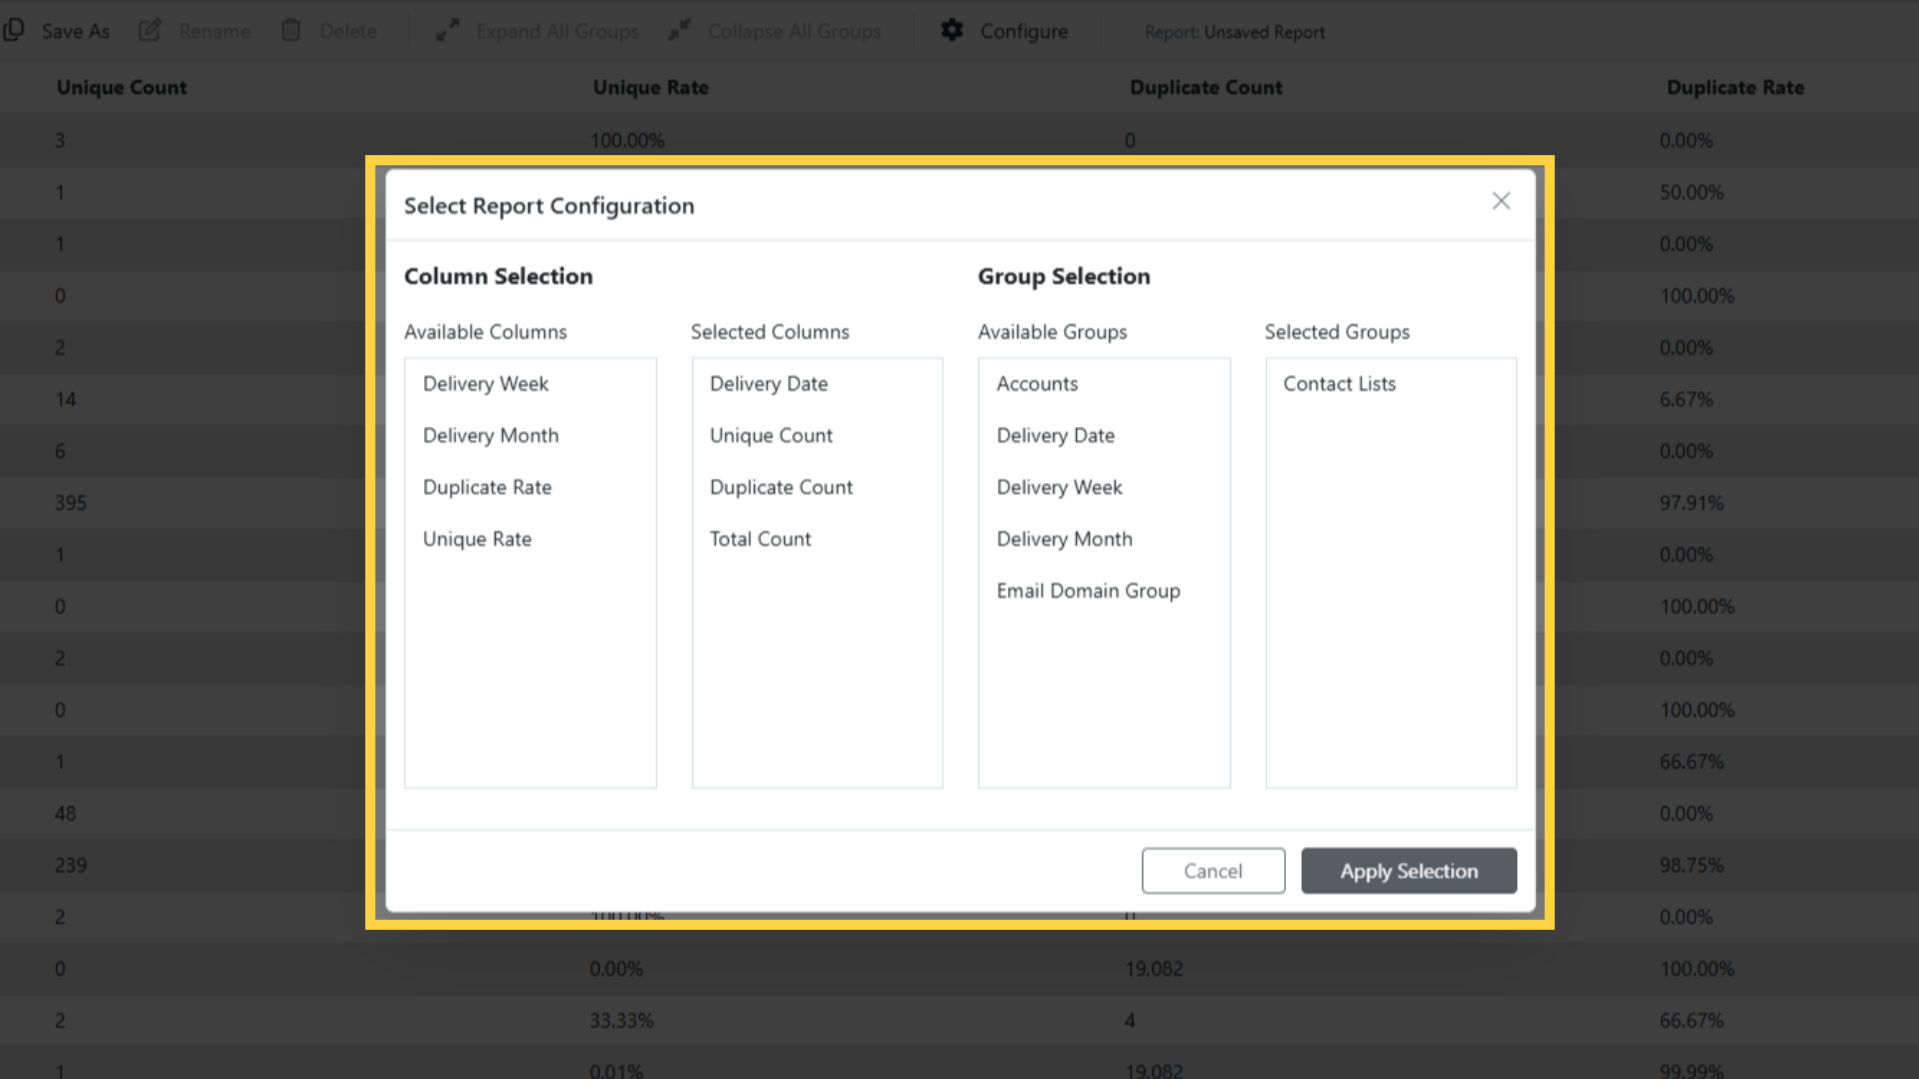
| Column | What it shows |
|---|---|
| Delivery Date | The day, when grouped by day |
| Delivery Week | The week, when grouped by week |
| Delivery Month | The month, when grouped by month |
| Unique Count | Contacts seen once in this group |
| Duplicate Count | Contacts already counted elsewhere in this group |
| Total Count | Unique plus duplicate |
| Unique Rate | Unique as a share of the total |
| Duplicate Rate | Duplicate as a share of the total |
Saving and exporting
Save, Save As, Rename and Delete keep a report setup under a name.
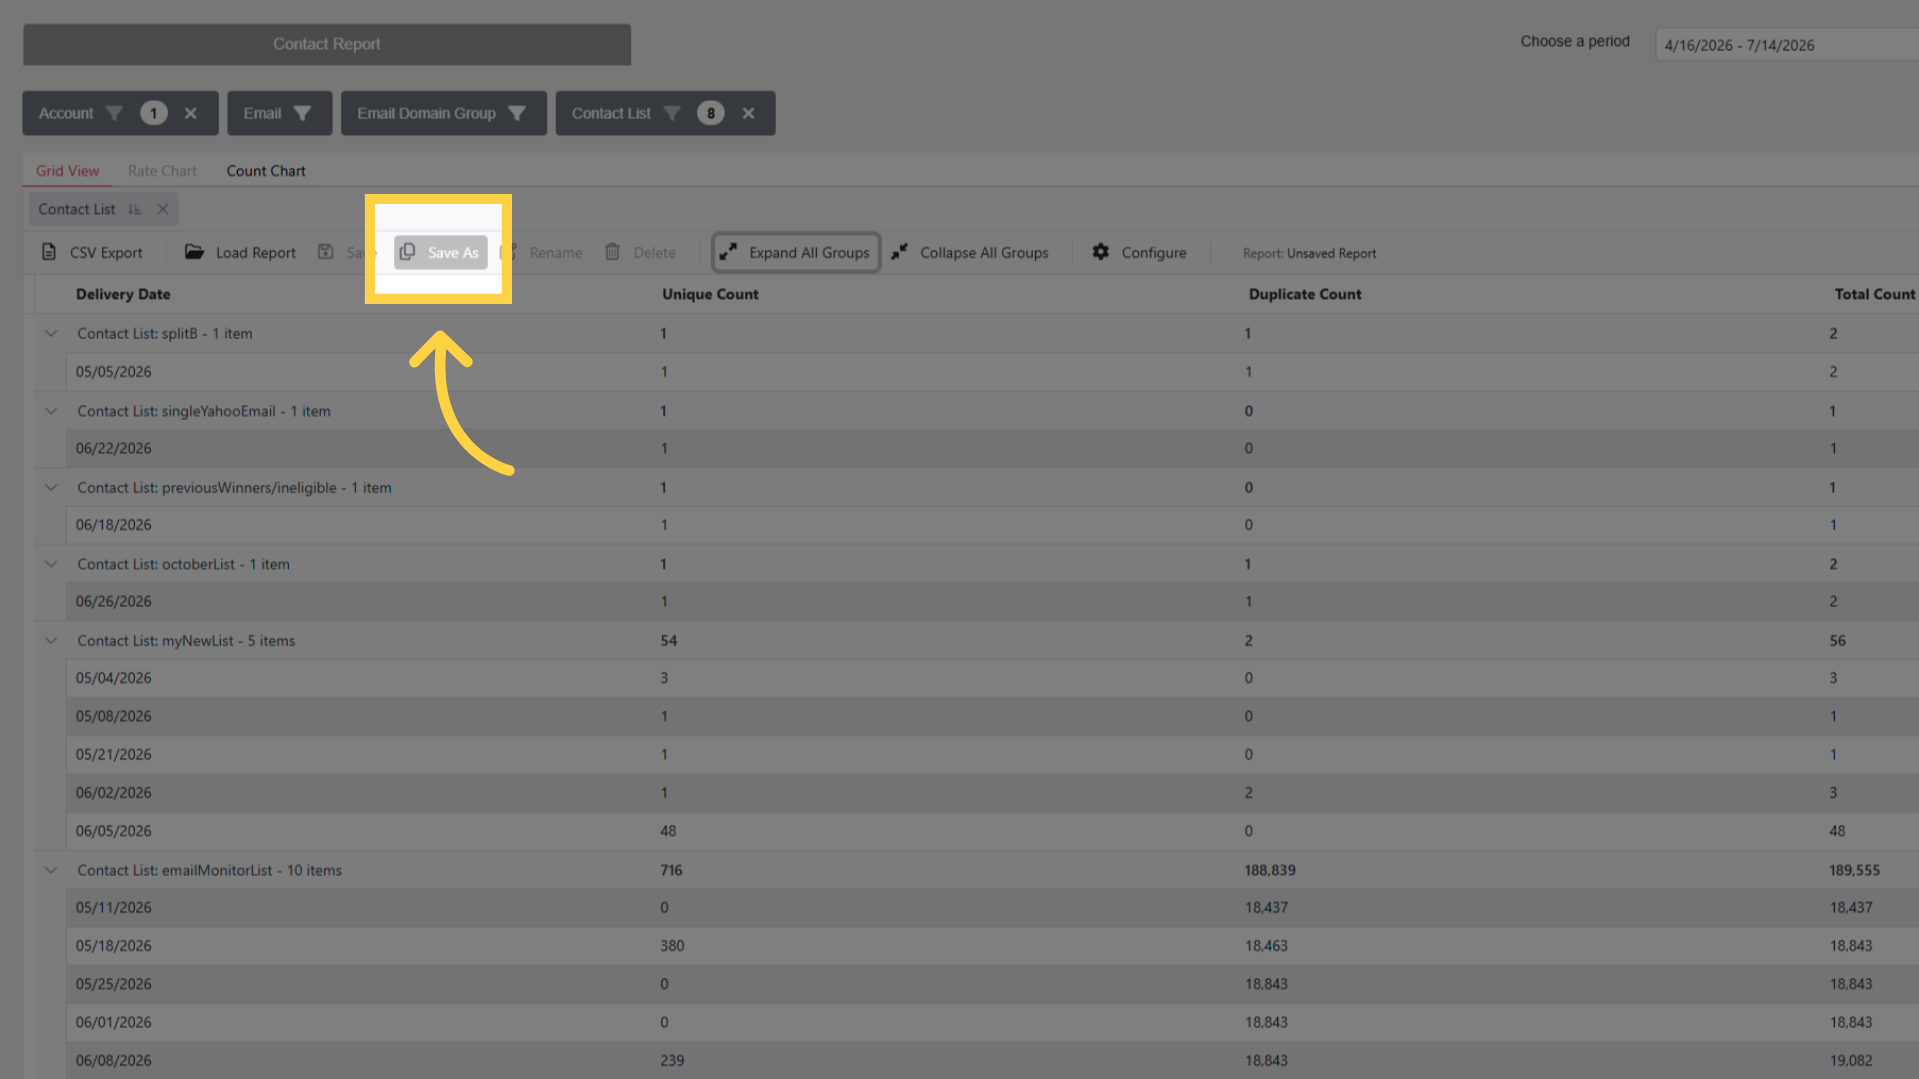
Load Report brings a saved one back.
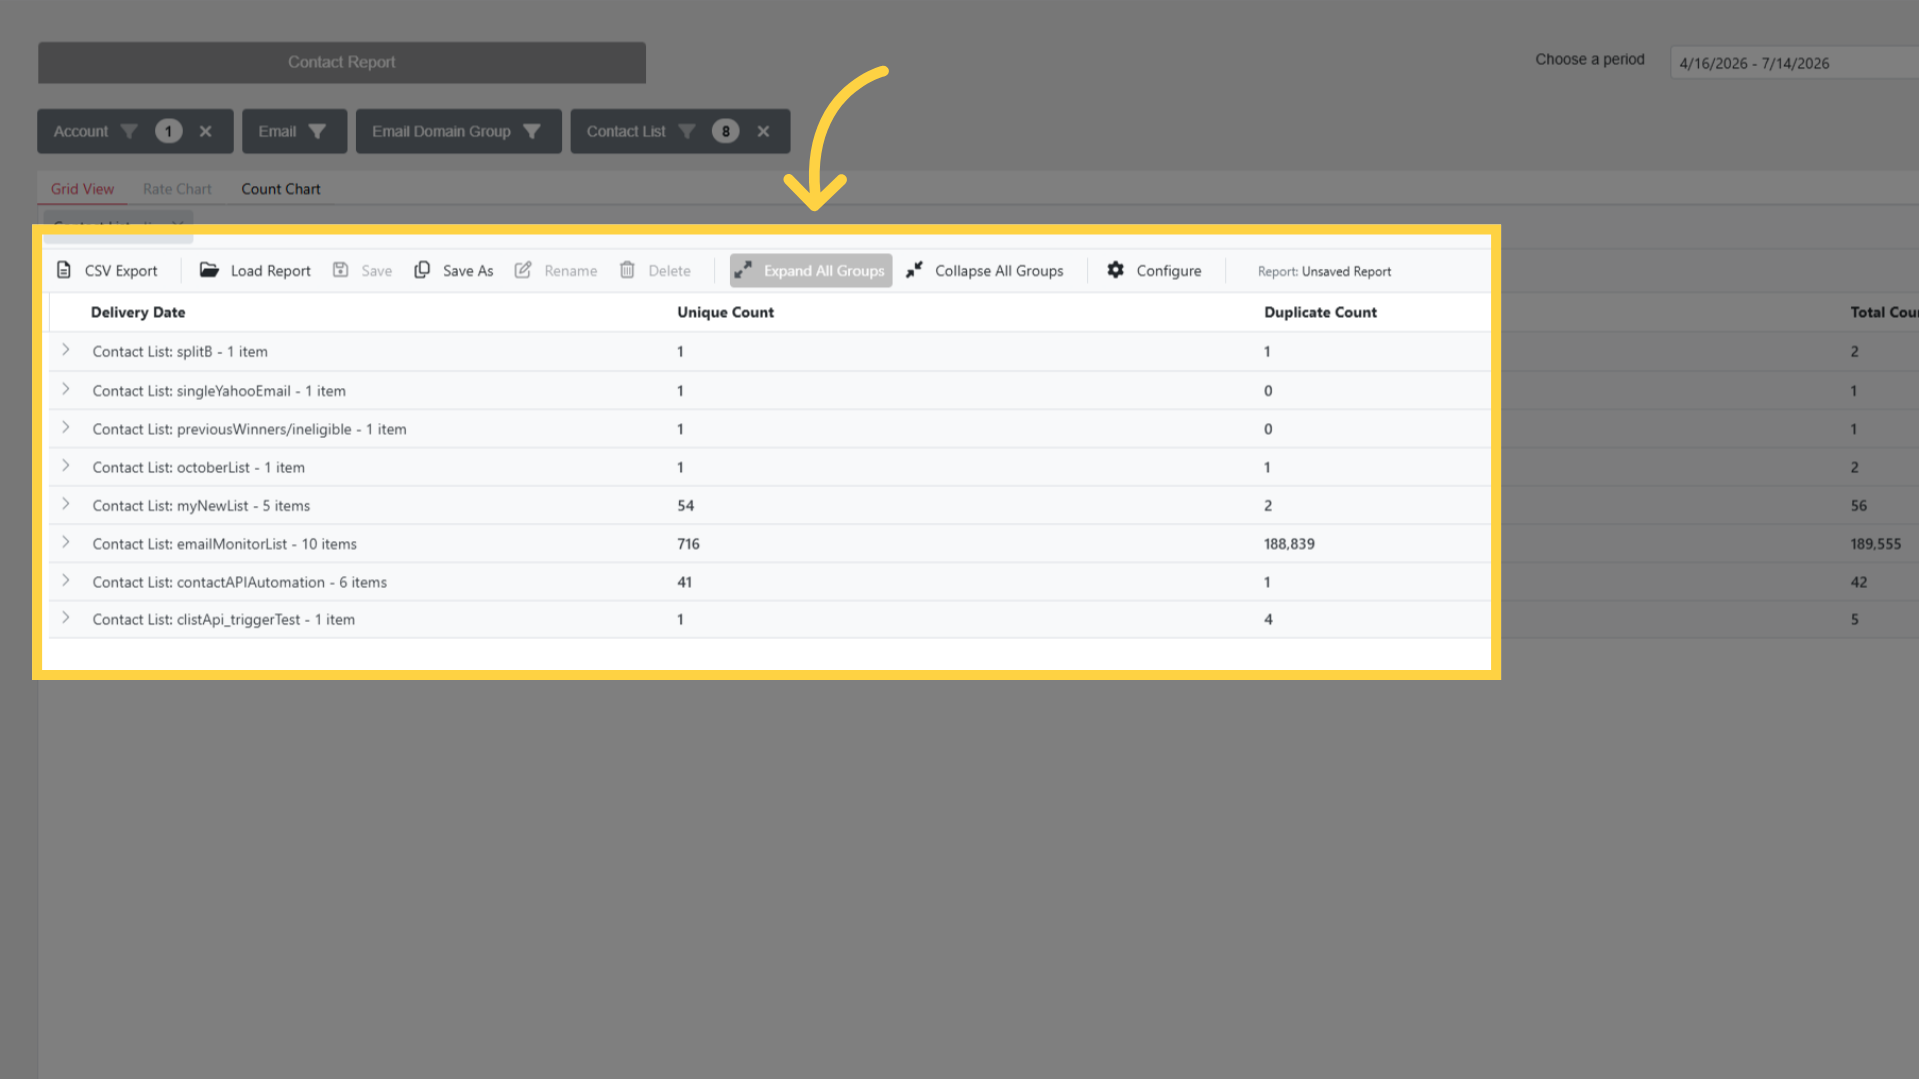
Expand All Groups and Collapse All Groups are in the toolbar once you have grouped.
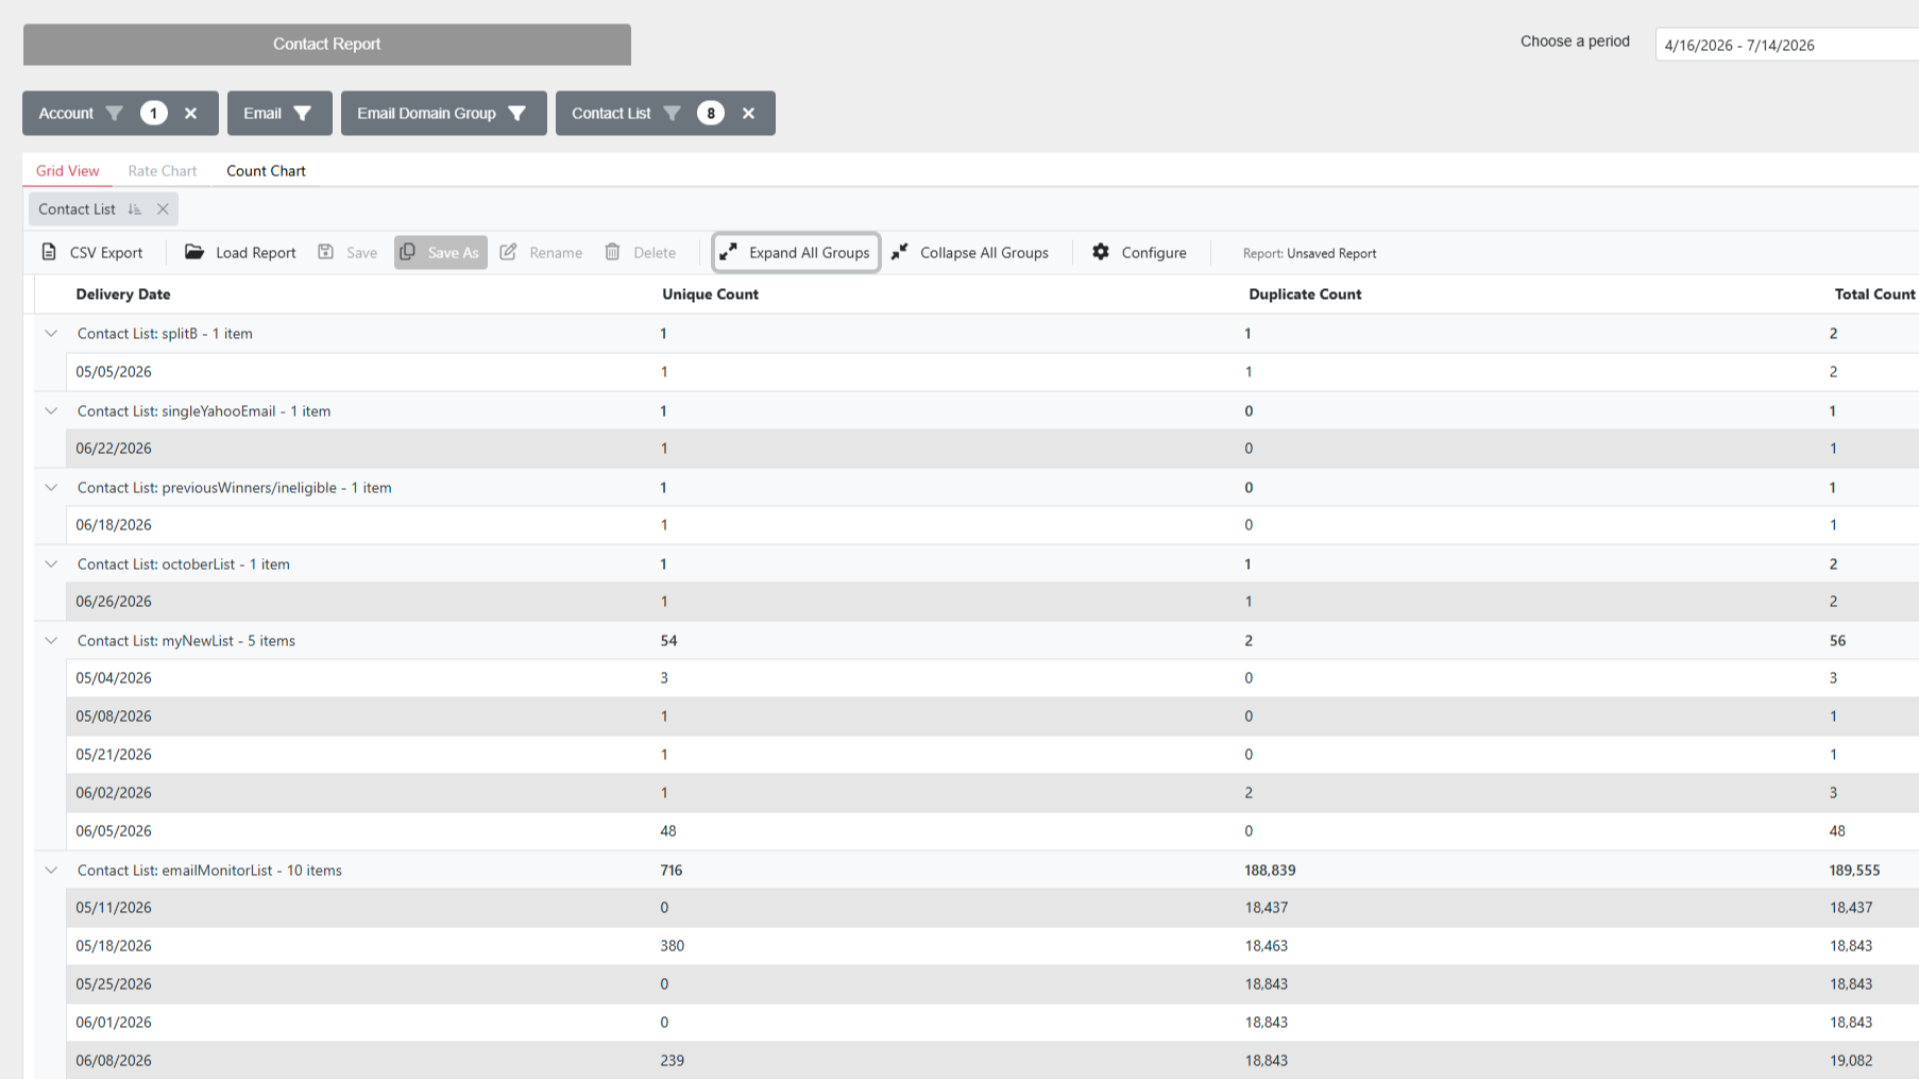
CSV Export downloads what you are looking at as
contact_report_<date>.csv.
Related pages
- Advanced Report — delivery and action figures by any dimension
- Contact Lists — the lists these contacts belong to
- Reports — the reports section